Providing developers the best model for the task at hand has always been our goal. Earlier this year, we made that easier by launching Auto model selection, which reviews your task and matches it to the best-suited model for that task.
Today, we’re introducing Project HydraFusion, a research preview that delivers frontier intelligence through runtime orchestration. It creates a full execution plan, choosing from models across multiple providers to draft, critique and revise, or cascade to more powerful models to complete your task.
HydraFusion fills a key role in our overall strategy to deliver automated semantic routing between local, cloud, and compound models. For developers, that complexity stays behind the scenes: you select HydraFusion like any other model, and it chooses a workflow that balances performance, cost, and latency for each task.
HydraFusion treats workflow selection as an optimization problem. It uses capability signals for reasoning, code generation, debugging, and tool use to select the most efficient execution pattern to meet the quality bar.
For each request, HydraFusion currently chooses one of three execution patterns:
- Single. One selected model solves the task directly.
- Cascade. An efficient model drafts a solution and a quality gate decides whether to accept it or escalate to a stronger model.
- Critique. One model drafts a result, an independent read-only critic from a different model family reviews it (following the same review pattern as Rubber Duck), and the drafting model revises once.
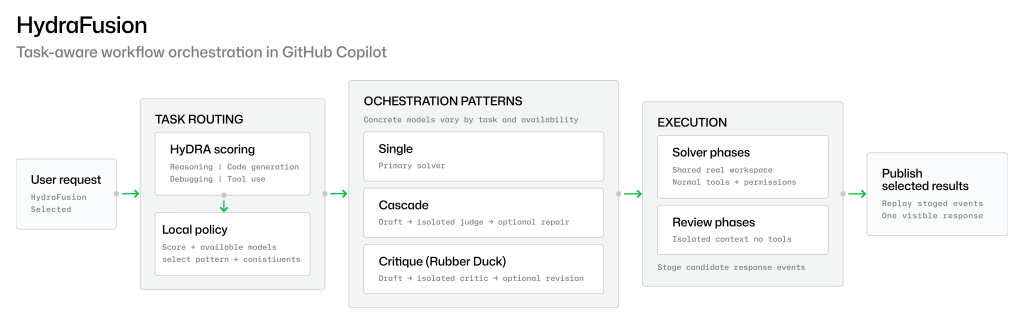
Each pattern addresses a different quality-to-cost trade-off. Single preserves speed and efficiency when one model can solve the task directly. Cascade gives an efficient model the first attempt while retaining a path to stronger inference when the candidate does not clear the acceptance gate. Critique adds an independent perspective for tasks where review is more useful than another unaided attempt.
In offline evaluations across three agentic coding benchmarks, HydraFusion consistently demonstrated frontier-level quality with substantial estimated cost savings. On TerminalBench 2.1, it improved verified task quality by 4.9 percentage points at 67% lower estimated cost compared with Claude Opus 5.
Let’s dive into the approach, the results, and the benchmarks.
Adaptive multi-model orchestration
Developers already coordinate models manually: choosing one for a task, asking another to review the work, or escalating a difficult problem to a more capable model. HydraFusion brings that familiar process into the runtime. You choose HydraFusion once and stay focused on your task while it manages the models and workflow behind the scenes.
The key is selectivity. Some coding tasks can be solved directly, while others benefit from review, revision, or escalation. HydraFusion evaluates each request and chooses the least complex workflow expected to meet its needs, using additional model calls only when they are likely to improve the result. This adaptive approach balances quality, cost, and latency across models.
As the model frontier advances, so does HydraFusion. When new models become available in GitHub Copilot, we can evaluate and incorporate them into its model pool, bringing their strengths to the tasks best suited to them.
Building HydraFusion
Turning adaptive multi-model orchestration into one dependable coding experience requires careful control of execution, review, cost, and repository state. HydraFusion is built around five operating principles:
- Complete accounting. Aggregate cost and usage across every workflow leg, including drafting, critique, revision, escalation, retry, and fallback.
- Bounded execution. Give each leg explicit timeout and cancellation behavior to keep execution and cost within defined limits.
- Isolated review. Run review steps in isolated, tool-less contexts, while solver steps use the shared workspace and normal permission-aware agent loop. This allows models to assess the work independently without modifying the repository.
- Fail-safe application. Apply no patch when the workflow is cancelled or fails validation, preventing incomplete changes from reaching the repository.
- Validated routing. Verify workflow definitions, model bindings, fallback behavior, and model availability before execution begins.
Together, these principles make multi-model orchestration practical for repository-level work. Internally, the runtime records the role, outcome, cost, latency, and diagnostics of each leg so the workflow can be understood after execution. Externally, the developer receives one coherent response and one permission-aware change set.
Benchmarking results
Fixed HydraFusion policies were evaluated across three agentic coding benchmarks — TerminalBench 2.1, DeepSWE, and CheckpointBench, our internal benchmark based on real GitHub Copilot sessions — using Claude Opus 5 and GPT-5.6 Sol as comparison baselines. Each policy used the same task inputs, tools, execution limits, pricing assumptions, grading conditions, and treatment of missing results. The evaluation measured verified task quality, which is the share of tasks confirmed as correctly answered, and the complete estimated workflow cost. Cost accounting included every invoked leg, such as drafting, critique, revision, escalation, retry, and fallback. The results below show the best tuned HydraFusion configuration.
| Benchmarks | Cost vs. Opus 5 | Quality vs. Opus 5 |
|---|---|---|
| TerminalBench 2.1 | 67% lower | +4.9 points |
| DeepSWE | 36% lower | -1.5 points |
| CheckpointBench | 65% lower | -0.1 points |
These controlled offline results are specific to the evaluated benchmark revisions, workflow configurations, model pool, and pricing assumptions, with all models evaluated at the same medium reasoning level. Through this research preview, we’ll validate how these results translate to real developer workloads and use the findings to further optimize HydraFusion for production quality, latency, reliability, caching efficiency, cost, and safety.
TerminalBench 2.1
TerminalBench 2.1 evaluates coding agents on complex, multi-step tasks in terminal environments.
Figure 2 compares HydraFusion and Opus 5 across verified task quality and estimated workflow cost.
.ghchart {
/* Theme tokens */
–ghc-text: #1f2328;
–ghc-muted: #656d76;
–ghc-grid: #d0d7de;
–ghc-axis: #59636e;
–ghc-card-bg: #ffffff;
–ghc-card-border: #d0d7de;
–ghc-divider: #b6bfb8;
–ghc-guide: #afb8c1;
/* GitHub brand font — matches the github.blog stack (Mona Sans, with
the blog’s metric fallback) so it renders identically in-context. */
font-family: “Mona Sans”, “Mona Sans Fallback”, -apple-system, “system-ui”,
“Segoe UI”, Helvetica, Arial, sans-serif;
-webkit-font-smoothing: antialiased;
text-rendering: optimizeLegibility;
position: relative;
box-sizing: border-box;
width: 100%;
max-width: 699px;
margin: 0 auto;
color: var(–ghc-text);
line-height: 1.4;
}
.ghchart *,
.ghchart *::before,
.ghchart *::after { box-sizing: border-box; }
/* —————————————————————— */
/* Header + legend */
/* —————————————————————— */
.ghchart__header {
display: flex;
justify-content: flex-end;
align-items: center;
min-height: 24px;
margin-bottom: 4px;
}
.ghchart__legend {
display: flex;
align-items: center;
gap: 20px;
flex-wrap: wrap;
justify-content: flex-end;
}
.ghchart__legend-item {
display: inline-flex;
align-items: center;
gap: 8px;
font-size: clamp(14px, 1.9vw, 17px);
font-weight: 600;
color: var(–ghc-muted);
white-space: nowrap;
}
.ghchart__swatch {
width: 14px;
height: 14px;
border-radius: 4px;
flex: 0 0 auto;
}
/* —————————————————————— */
/* Plot (SVG) */
/* —————————————————————— */
.ghchart__plot {
display: block;
width: 100%;
height: auto;
overflow: visible;
touch-action: pan-y;
}
.ghchart__gridline {
stroke: var(–ghc-grid);
stroke-width: 1;
stroke-dasharray: 2 6;
stroke-linecap: round;
opacity: 0.9;
}
.ghchart__axislabel {
fill: var(–ghc-axis);
font-size: 22px;
font-weight: 500;
}
.ghchart__axislabel–x { font-weight: 600; }
.ghchart__line {
fill: none;
stroke-linecap: round;
stroke-linejoin: round;
}
.ghchart__dot { transition: r 0.12s ease; }
/* Dashed threshold line (e.g. a target/reference level) + floating label.
Stroke color is set inline per chart; dash + label styling live here. */
.ghchart__threshold {
stroke-width: 2;
stroke-dasharray: 7 6;
stroke-linecap: round;
opacity: 0.9;
}
.ghchart__threshold-label {
font-size: 20px;
font-weight: 700;
letter-spacing: -0.01em;
}
/* Hatched band marking a partial / projected trailing region. */
.ghchart__projection { pointer-events: none; }
.ghchart__guide {
stroke: var(–ghc-guide);
stroke-width: 1.5;
stroke-dasharray: 4 4;
opacity: 0;
transition: opacity 0.12s ease;
}
.ghchart__hit { fill: transparent; }
/* —————————————————————— */
/* Scatter plot */
/* —————————————————————— */
.ghchart__gridline–v { /* vertical gridlines reuse the dashed grid style */ }
.ghchart__axistitle {
fill: var(–ghc-muted);
font-size: 20px;
font-weight: 600;
letter-spacing: -0.01em;
}
/* Dotted reference crosshair through the “reference” point. Stroke color
is set inline (tracks the reference series color). */
.ghchart__crosshair {
stroke-width: 2;
stroke-dasharray: 2 7;
stroke-linecap: round;
opacity: 0.85;
pointer-events: none;
}
.ghchart__halo { opacity: 0.18; pointer-events: none; }
.ghchart__pt { transition: r 0.12s ease; }
.ghchart__pt-label {
fill: var(–ghc-muted);
font-size: 19px;
font-weight: 600;
letter-spacing: -0.01em;
pointer-events: none;
}
.ghchart__pt-label–strong { font-size: 21px; font-weight: 700; }
.ghchart__pthit { fill: transparent; cursor: default; outline: none; }
.ghchart__pthit:focus-visible {
outline: 2px solid var(–ghc-axis);
outline-offset: 1px;
}
.ghchart__swatch–dot { border-radius: 50%; }
/* —————————————————————— */
/* Trend chart (dated time-series with narrative headline) */
/* —————————————————————— */
.ghchart__headline {
font-size: clamp(17px, 2.3vw, 20px);
line-height: 1.32;
font-weight: 700;
letter-spacing: -0.01em;
color: var(–ghc-text);
margin: 0 0 8px;
}
/* Trend legend sits left-aligned under the headline/subtitle. */
.ghchart__legend–trend {
justify-content: flex-start;
margin: 2px 0 14px;
}
.ghchart__glyph { flex: 0 0 auto; }
.ghchart__glyph–square {
width: 13px; height: 13px; border-radius: 2px;
}
.ghchart__glyph–diamond {
width: 12px; height: 12px; border: 1.5px solid; transform: rotate(45deg);
}
.ghchart__glyph–line {
width: 20px; height: 0; border-top: 2px dashed; border-radius: 0;
}
/* Phase background columns + separators + top labels. */
.ghchart__phase { fill: #f6f8fa; opacity: 0.55; }
.ghchart__phase–alt { fill: #ffffff; opacity: 0; }
.ghchart__phase-sep {
stroke: var(–ghc-grid); stroke-width: 1; stroke-dasharray: 2 5; opacity: 0.8;
}
.ghchart__phase-label {
fill: var(–ghc-muted);
font-size: 15px;
font-weight: 700;
letter-spacing: 0.06em;
}
.ghchart__phase-avg {
font-size: 16px;
font-weight: 700;
letter-spacing: -0.01em;
}
/* Dashed trend line + ± noise band + slope label. */
.ghchart__trendband { opacity: 0.12; pointer-events: none; }
.ghchart__trendline {
stroke-width: 2.5;
stroke-dasharray: 8 6;
stroke-linecap: round;
fill: none;
}
.ghchart__slope {
font-size: 20px;
font-weight: 700;
letter-spacing: -0.01em;
}
/* Horizontal reference line + label. */
.ghchart__refline {
stroke-width: 2;
stroke-dasharray: 7 6;
stroke-linecap: round;
opacity: 0.85;
}
.ghchart__reflabel {
font-size: 16px;
font-weight: 700;
letter-spacing: -0.01em;
}
/* Data squares — values reveal on hover only. */
.ghchart__square { transition: width 0.12s ease, height 0.12s ease, x 0.12s ease, y 0.12s ease; }
.ghchart__squarehit { fill: transparent; cursor: default; outline: none; }
.ghchart__squarehit:focus-visible {
outline: 2px solid var(–ghc-axis);
outline-offset: 1px;
}
/* Invalid-run markers + leader-line annotations. */
.ghchart__invalid { stroke-width: 2; }
.ghchart__invalid-x { stroke-width: 2; stroke-linecap: round; }
.ghchart__leader { stroke-width: 1; stroke-dasharray: 2 3; opacity: 0.8; }
.ghchart__leader–callout { stroke-dasharray: none; opacity: 0.6; }
.ghchart__anno-title {
font-size: 15px;
font-weight: 700;
letter-spacing: -0.01em;
}
.ghchart__anno-sub {
fill: var(–ghc-muted);
font-size: 13px;
font-weight: 500;
}
/* Final-callout labels read a touch larger than the invalid-run notes. */
.ghchart__anno-title–callout { font-size: 17px; }
.ghchart__anno-sub–callout { font-size: 14px; }
/* Bracket span annotation. */
.ghchart__bracket { stroke: var(–ghc-axis); stroke-width: 1.5; opacity: 0.75; }
.ghchart__bracket-label {
fill: var(–ghc-muted);
font-size: 13px;
font-weight: 700;
letter-spacing: 0.04em;
}
/* Final callout ring. */
.ghchart__callout-ring { fill: none; stroke-width: 2; }
/* —————————————————————— */
/* Title + divider */
/* —————————————————————— */
.ghchart__title {
/* Matches the github.blog H2 (.wp-block-heading) exactly */
display: block;
font-size: 32px;
line-height: 40px;
font-weight: 700;
letter-spacing: -0.18px;
color: var(–ghc-text);
}
.ghchart__rule {
height: 1.5px;
border-radius: 1.5px;
background: var(–ghc-divider);
margin: 10px 0 18px;
}
/* —————————————————————— */
/* Bar chart: subtitle, panels, bars, caption */
/* —————————————————————— */
.ghchart__subtitle {
margin: -6px 0 20px;
font-size: clamp(13px, 1.6vw, 15px);
line-height: 1.5;
color: var(–ghc-muted);
}
.ghchart__panel { margin-top: 30px; }
.ghchart__panel:first-of-type { margin-top: 6px; }
.ghchart__panel-title {
margin: 0 0 6px;
font-size: clamp(15px, 1.9vw, 18px);
font-weight: 700;
letter-spacing: -0.01em;
color: var(–ghc-text);
}
.ghchart__plot–bar { touch-action: pan-y; }
.ghchart__axisline {
stroke: var(–ghc-axis);
stroke-width: 1.25;
opacity: 0.35;
}
.ghchart__bar { transition: opacity 0.12s ease; }
.ghchart__barhit { fill: transparent; }
/* Always-on value labels above selected bars. */
.ghchart__barvalue {
fill: var(–ghc-text);
font-size: 20px;
font-weight: 700;
font-variant-numeric: tabular-nums;
pointer-events: none;
}
/* Anchor annotation: dotted reference line + floating pill. */
.ghchart__anno-line {
stroke: #8b949e;
stroke-width: 1.5;
stroke-dasharray: 4 3;
stroke-linecap: round;
pointer-events: none;
}
.ghchart__anno-chip {
fill: #ffebe9;
stroke: #ffcecb;
stroke-width: 1;
pointer-events: none;
}
.ghchart__anno-chip-text {
fill: #a0111f;
font-weight: 700;
pointer-events: none;
}
.ghchart__caption {
margin-top: 22px;
padding-top: 12px;
border-top: 1px solid var(–ghc-card-border);
font-size: 12.5px;
line-height: 1.55;
color: var(–ghc-muted);
}
.ghchart__caption b { color: var(–ghc-text); font-weight: 700; }
.ghchart__caption code {
font-family: ui-monospace, SFMono-Regular, “SF Mono”, Menlo, Consolas, monospace;
font-size: 0.92em;
padding: 1px 5px;
background: #f6f8fa;
border: 1px solid var(–ghc-card-border);
border-radius: 5px;
}
.ghchart__tag {
display: inline-block;
font-size: 10px;
font-weight: 650;
letter-spacing: 0.03em;
text-transform: uppercase;
padding: 2px 7px;
border-radius: 999px;
border: 1px solid #aceebb;
color: #0a5223;
background: #dafbe1;
white-space: nowrap;
vertical-align: middle;
}
/* —————————————————————— */
/* Distribution dashboard (segmented mix bar + ranked bar panels) */
/* —————————————————————— */
.ghchart__dist-section { margin-top: 28px; }
.ghchart__dist-section:first-of-type { margin-top: 12px; }
/* Segmented proportional “mix” bar: name inside, count/percent below.
Separators are 2px inside borders (box-sizing:border-box) rather than a
flex gap, so the three segments sum to exactly 100% with no overflow. */
.ghchart__seg {
display: flex;
width: 100%;
height: 42px;
margin-top: 2px;
border-radius: 7px;
overflow: hidden;
}
.ghchart__seg-cell {
display: flex;
align-items: center;
justify-content: center;
min-width: 0;
color: #ffffff;
font-size: 15px;
font-weight: 700;
letter-spacing: -0.01em;
white-space: nowrap;
overflow: hidden;
}
.ghchart__seg-cell + .ghchart__seg-cell { border-left: 2px solid var(–ghc-card-bg); }
.ghchart__seg-note-row {
display: flex;
width: 100%;
margin-top: 8px;
}
.ghchart__seg-note {
min-width: 0;
text-align: center;
font-size: 12.5px;
color: var(–ghc-muted);
font-variant-numeric: tabular-nums;
white-space: nowrap;
}
/* Keep the outer notes from spilling past the chart edges. */
.ghchart__seg-note:first-child { text-align: left; }
.ghchart__seg-note:last-child { text-align: right; }
.ghchart__seg-note b { color: var(–ghc-text); font-weight: 700; }
/* Ranked horizontal bar list: [category | bar track | value].
The list is the grid and rows use display:contents, so the category,
bar, and value columns line up across every row in a panel. */
.ghchart__dist-list {
display: grid;
grid-template-columns: max-content 1fr max-content;
align-items: center;
column-gap: 12px;
row-gap: 10px;
margin-top: 4px;
}
.ghchart__dist-row { display: contents; }
.ghchart__dist-cat {
text-align: right;
font-size: 13px;
line-height: 1.25;
color: var(–ghc-text);
white-space: nowrap;
}
.ghchart__dist-track { width: 100%; }
.ghchart__dist-bar {
height: 15px;
min-width: 2px;
border-radius: 3px;
}
.ghchart__dist-val {
font-size: 12.5px;
color: var(–ghc-muted);
font-variant-numeric: tabular-nums;
white-space: nowrap;
}
.ghchart__dist-val b { color: var(–ghc-text); font-weight: 700; }
/* Two-up panel grid (collapses to one column on narrow screens).
minmax(0,1fr) lets columns shrink so long labels never force overflow. */
.ghchart__dist-cols {
margin-top: 26px;
display: grid;
grid-template-columns: repeat(2, minmax(0, 1fr));
gap: 24px 30px;
}
.ghchart__dist-cols .ghchart__dist-section { margin-top: 0; }
.ghchart__dist-cols–stack { grid-template-columns: 1fr; }
.ghchart__dist-cols–stack .ghchart__dist-section { margin-top: 28px; }
.ghchart__dist-cols–stack .ghchart__dist-section:first-child { margin-top: 0; }
/* Tighten the label/value type a touch in the 2-up layout so the bars
keep room at the 699px blog width. */
.ghchart__dist-cols:not(.ghchart__dist-cols–stack) .ghchart__dist-cat { font-size: 12px; }
.ghchart__dist-cols:not(.ghchart__dist-cols–stack) .ghchart__dist-val { font-size: 11.5px; }
.ghchart__dist-cols:not(.ghchart__dist-cols–stack) .ghchart__dist-list { column-gap: 9px; }
@media (max-width: 600px) {
.ghchart__dist-cols { grid-template-columns: 1fr; gap: 26px; }
.ghchart__dist-cols .ghchart__dist-section ~ .ghchart__dist-section { margin-top: 2px; }
}
/* Let long category labels wrap on very narrow (mobile) widths. */
@media (max-width: 480px) {
.ghchart__dist-cat { white-space: normal; }
}
/* —————————————————————— */
/* Calendar heatmap (GitHub contribution-graph style) */
/* —————————————————————— */
.ghheat__eyebrow { display: flex; align-items: center; gap: 8px; margin: 0 0 12px; }
.ghheat__eyedot {
width: 9px; height: 9px; border-radius: 50%;
background: #cf222e; box-shadow: 0 0 0 3px rgba(207, 34, 46, 0.14);
flex: 0 0 auto;
}
.ghheat__eyetext {
font-size: 12px; font-weight: 700; letter-spacing: 0.08em;
text-transform: uppercase; color: #cf222e;
}
/* Subtitle here is a prominent lede, not the muted variant. */
.ghheat__subtitle {
color: var(–ghc-text);
font-size: clamp(14px, 1.7vw, 16px);
/* 24px top gap matches the github.blog H2 → paragraph block spacing. */
margin: 24px 0 8px;
}
.ghheat__subtitle b { font-weight: 700; }
.ghheat__panel { margin-top: 36px; }
.ghheat__phead {
display: flex; align-items: baseline; gap: 9px; flex-wrap: wrap;
margin-bottom: 16px;
}
.ghheat__badge {
display: inline-flex; align-items: center; justify-content: center;
width: 22px; height: 22px; border-radius: 50%;
color: #fff; font-size: 12px; font-weight: 700;
flex: 0 0 auto; align-self: center;
}
.ghheat__ptitle {
font-size: clamp(16px, 2vw, 19px); font-weight: 700;
letter-spacing: -0.01em; color: var(–ghc-text);
}
.ghheat__pdesc { font-size: 14px; color: var(–ghc-muted); }
.ghheat__body { display: flex; gap: 30px; align-items: flex-start; flex-wrap: wrap; }
.ghheat__gridwrap { flex: 1 1 340px; min-width: 260px; }
.ghheat__grid { display: block; width: 100%; height: auto; overflow: visible; }
.ghheat__cell {
stroke: rgba(27, 31, 36, 0.06);
stroke-width: 1;
transition: stroke 0.1s ease;
}
.ghheat__cell:hover { stroke: #24292f; stroke-width: 1.4; }
.ghheat__cell–pad { opacity: 0; pointer-events: none; }
.ghheat__wd, .ghheat__month {
fill: var(–ghc-muted); font-size: 11px; font-weight: 600;
}
.ghheat__side { flex: 1 1 250px; min-width: 230px; }
.ghheat__stat { display: flex; align-items: baseline; gap: 7px; }
.ghheat__statbig {
font-size: clamp(26px, 4vw, 34px); font-weight: 800; letter-spacing: -0.02em;
line-height: 1;
}
.ghheat__statsmall { font-size: 15px; font-weight: 600; color: var(–ghc-muted); }
.ghheat__note {
margin: 10px 0 16px; font-size: 14px; line-height: 1.55; color: var(–ghc-muted);
}
.ghheat__note b { color: var(–ghc-text); font-weight: 700; }
.ghheat__legend {
display: flex; align-items: center; gap: 5px;
font-size: 12.5px; color: var(–ghc-muted); flex-wrap: wrap;
}
.ghheat__sw { width: 12px; height: 12px; border-radius: 3px; display: inline-block; flex: 0 0 auto; }
.ghheat__sw–empty { border: 1px solid #d0d7de; }
.ghheat__legunit { margin-left: 2px; }
.ghheat__extra {
display: flex; align-items: flex-start; gap: 7px; margin-top: 14px;
font-size: 12px; line-height: 1.5; color: var(–ghc-muted); max-width: 330px;
}
.ghheat__extra .ghheat__sw { margin-top: 2px; }
/* —————————————————————— */
/* Tooltip */
/* —————————————————————— */
.ghchart__tooltip {
position: absolute;
z-index: 5;
top: 0;
left: 0;
min-width: 128px;
max-width: 260px;
padding: 10px 12px;
background: var(–ghc-card-bg);
border: 1px solid var(–ghc-card-border);
border-radius: 12px;
/* Layered drop shadow from Primer Brand’s ActionMenu (.ActionMenu__menu) */
box-shadow:
0px 100px 80px rgba(0, 0, 0, 0.01),
0px 41px 33px rgba(0, 0, 0, 0.02),
0px 22px 17px rgba(0, 0, 0, 0.02),
0px 12px 10px rgba(0, 0, 0, 0.03),
0px 6px 5px rgba(0, 0, 0, 0.04),
0px 2px 2px rgba(0, 0, 0, 0.07);
pointer-events: none;
opacity: 0;
transform: translate(-50%, -100%);
/* Fade in on show and out on hide; quickly ease left/top when tracking
from one point to the next. The position ease is suppressed on the
first appearance (see chart.js) so the tooltip fades in place rather
than sliding in from its previous spot. */
transition: opacity 0.12s ease,
left 0.1s cubic-bezier(0.4, 0, 0.2, 1),
top 0.1s cubic-bezier(0.4, 0, 0.2, 1);
will-change: opacity, transform, left, top;
}
.ghchart__tooltip[data-visible=”true”] { opacity: 1; }
.ghchart__tt-title {
font-size: 13px;
font-weight: 700;
color: var(–ghc-text);
margin-bottom: 6px;
}
.ghchart__tt-row {
display: flex;
align-items: center;
gap: 8px;
font-size: 13px;
line-height: 1.6;
color: var(–ghc-muted);
}
.ghchart__tt-swatch { width: 10px; height: 10px; border-radius: 3px; flex: 0 0 auto; }
.ghchart__tt-name { flex: 1 1 auto; }
.ghchart__tt-value { font-weight: 700; color: var(–ghc-text); font-variant-numeric: tabular-nums; }
/* Bar tooltip body: a title line + free-form text lines (no swatches). */
.ghchart__tt-line {
font-size: 13px;
line-height: 1.5;
color: var(–ghc-muted);
}
.ghchart__tt-line:first-child { color: var(–ghc-text); font-weight: 600; }
.ghchart__tt-line + .ghchart__tt-line { margin-top: 2px; }
@media (prefers-reduced-motion: reduce) {
.ghchart__dot,
.ghchart__guide,
.ghchart__bar,
.ghchart__pt,
.ghchart__square,
.ghheat__cell,
.ghchart__tooltip { transition: none; }
}
/*
Shared chart engine — reusable renderer for the blog-charts library.
——————————————————————
Exposes window.GHChartEngine = { renderers, render(config, mountEl?) }.
Renderers are keyed by config.type (currently “line”); add a new viz type
by registering GHChartEngine.renderers[] = function (root, config) {…}.
This same file is embedded verbatim at the top of each exported WordPress
chart.js, followed by that chart’s CONFIG + a small auto-boot. It has no
external dependencies and is safe to include more than once on a page.
*/
(function (global) {
“use strict”;
var SVGNS = “http://www.w3.org/2000/svg”;
function el(tag, attrs) {
var node = document.createElementNS(SVGNS, tag);
if (attrs) {
for (var k in attrs) {
if (Object.prototype.hasOwnProperty.call(attrs, k)) {
node.setAttribute(k, attrs[k]);
}
}
}
return node;
}
function html(tag, cls) {
var node = document.createElement(tag);
if (cls) node.className = cls;
return node;
}
function clamp(v, lo, hi) { return v hi ? hi : v; }
var renderers = {};
/* ================================================================
Line chart renderer
================================================================ */
renderers.line = function (root, config) {
// viewBox geometry (design units; scales fluidly to any width).
var VB = { w: 1000, h: 560 };
var M = { top: 30, right: 34, bottom: 56, left: 86 };
// Inset the plotted points slightly from the axis so the first/last
// months (e.g. “Jan”) don’t crowd the y-axis labels (e.g. “50”).
var PAD_X = 18;
var innerW = VB.w – M.left – M.right;
var innerH = VB.h – M.top – M.bottom;
// Reset (in case of re-render) and use a unique id prefix so multiple
// charts on one page never share gradient ids.
root.textContent = “”;
var uid = config.mountId;
var n = config.labels.length;
var yMin = config.yAxis.min;
var yMax = config.yAxis.max;
var step = config.yAxis.step;
// Y-axis tick labels can format differently from the tooltip values
// (e.g. a plain “40” on the axis but “40%” in the tooltip).
var fmtAxis = config.formatAxis || config.formatValue;
var plotW = innerW – 2 * PAD_X;
var stepX = n <= 1 ? 0 : plotW / (n – 1);
function xAt(i) { return n <= 1 ? M.left + innerW / 2 : M.left + PAD_X + stepX * i; }
function yAt(v) { return M.top + innerH * (1 – (v – yMin) / (yMax – yMin)); }
var baseY = yAt(yMin);
/* —- Title + divider (top) ———————————- */
var title = html("span", "ghchart__title");
title.textContent = config.title;
root.appendChild(title);
root.appendChild(html("div", "ghchart__rule"));
/* —- Header + legend —————————————- */
if (!config.hideLegend) {
var header = html("div", "ghchart__header");
var legend = html("div", "ghchart__legend");
config.series.forEach(function (s) {
var item = html("span", "ghchart__legend-item");
var sw = html("span", "ghchart__swatch");
sw.style.background = s.color;
item.appendChild(sw);
item.appendChild(document.createTextNode(s.name));
legend.appendChild(item);
});
header.appendChild(legend);
root.appendChild(header);
}
/* —- SVG plot ———————————————– */
var svg = el("svg", {
"class": "ghchart__plot",
viewBox: "0 0 " + VB.w + " " + VB.h,
preserveAspectRatio: "xMidYMid meet",
role: "img",
"aria-label": config.title + " line chart"
});
// Gradient defs (one per area series).
var defs = el("defs");
config.series.forEach(function (s, si) {
if (!s.area) return;
var g = el("linearGradient", {
id: uid + "-grad-" + si, x1: "0", y1: "0", x2: "0", y2: "1"
});
g.appendChild(el("stop", { offset: "0", "stop-color": s.color, "stop-opacity": "0.28" }));
g.appendChild(el("stop", { offset: "0.55", "stop-color": s.color, "stop-opacity": "0.08" }));
g.appendChild(el("stop", { offset: "1", "stop-color": s.color, "stop-opacity": "0" }));
defs.appendChild(g);
});
// Diagonal-hatch pattern for an optional "partial / projected" band.
if (config.projection) {
var pat = el("pattern", {
id: uid + "-hatch", width: 7, height: 7,
patternUnits: "userSpaceOnUse", patternTransform: "rotate(45)"
});
pat.appendChild(el("line", {
x1: 0, y1: 0, x2: 0, y2: 7,
stroke: config.projection.color || "#8c959f",
"stroke-width": 1.1, "stroke-opacity": 0.5
}));
defs.appendChild(pat);
}
svg.appendChild(defs);
// Gridlines + y-axis labels.
for (var v = yMin; v cubic Bezier) path builder.
function smooth(points) {
if (!points.length) return “”;
if (points.length < 2) return "M" + points[0].x + "," + points[0].y;
var d = "M " + points[0].x + "," + points[0].y;
for (var i = 0; i < points.length – 1; i++) {
var p0 = points[i – 1] || points[i];
var p1 = points[i];
var p2 = points[i + 1];
var p3 = points[i + 2] || p2;
var t = 1 / 6;
var c1x = p1.x + (p2.x – p0.x) * t;
var c1y = p1.y + (p2.y – p0.y) * t;
var c2x = p2.x – (p3.x – p1.x) * t;
var c2y = p2.y – (p3.y – p1.y) * t;
d += " C " + c1x + "," + c1y + " " + c2x + "," + c2y + " " + p2.x + "," + p2.y;
}
return d;
}
// Area fills (drawn first, behind lines).
config.series.forEach(function (s, si) {
if (!s.area) return;
var p = pts[si];
var d = smooth(p) + " L " + p[p.length – 1].x + "," + baseY +
" L " + p[0].x + "," + baseY + " Z";
svg.appendChild(el("path", { d: d, fill: "url(#" + uid + "-grad-" + si + ")" }));
});
// Vertical hover guide (hidden until hover).
var guide = el("line", {
"class": "ghchart__guide",
x1: xAt(0), y1: M.top – 6, x2: xAt(0), y2: baseY
});
svg.appendChild(guide);
// Lines (draw in reverse so the first series sits on top).
config.series.slice().reverse().forEach(function (s) {
var si = config.series.indexOf(s);
svg.appendChild(el("path", {
"class": "ghchart__line",
d: smooth(pts[si]),
stroke: s.color,
"stroke-width": s.width || (si === 0 ? 4 : 3.25)
}));
});
// Dots (keep references for hover emphasis). When config.hideDots is set
// (dense daily lines), dots rest invisible and only the hovered one shows.
var dotEls = config.series.map(function (s, si) {
return pts[si].map(function (pt) {
var c = el("circle", {
"class": "ghchart__dot",
cx: pt.x, cy: pt.y,
r: config.hideDots ? 0 : (si === 0 ? 4.5 : 4),
fill: s.color
});
svg.appendChild(c);
return c;
});
});
// Transparent hit area for pointer capture.
var hit = el("rect", {
"class": "ghchart__hit",
x: M.left,
y: M.top – 6,
width: innerW,
height: baseY – M.top + 12
});
svg.appendChild(hit);
root.appendChild(svg);
/* —- Tooltip ———————————————— */
var tip = html("div", "ghchart__tooltip");
tip.setAttribute("role", "status");
var tipTitle = html("div", "ghchart__tt-title");
tip.appendChild(tipTitle);
var tipRows = config.series.map(function (s) {
var row = html("div", "ghchart__tt-row");
var sw = html("span", "ghchart__tt-swatch");
sw.style.background = s.color;
var name = html("span", "ghchart__tt-name");
name.textContent = s.name;
var val = html("span", "ghchart__tt-value");
row.appendChild(sw);
row.appendChild(name);
row.appendChild(val);
tip.appendChild(row);
return val;
});
root.appendChild(tip);
/* —- Hover / focus interactivity —————————- */
var activeIndex = -1;
var baseR = config.series.map(function (s, si) {
return config.hideDots ? 0 : (si === 0 ? 4.5 : 4);
});
// Radius of the single emphasized dot under the pointer.
var dotActiveR = config.series.map(function (s, si) {
return config.hideDots ? 6 : baseR[si] + 2.5;
});
var motionMQ = window.matchMedia
? window.matchMedia("(prefers-reduced-motion: reduce)")
: null;
function reduceMotion() { return !!(motionMQ && motionMQ.matches); }
function indexFromClientX(clientX) {
var rect = svg.getBoundingClientRect();
var relX = (clientX – rect.left) / rect.width * VB.w;
var i = stepX ? Math.round((relX – (M.left + PAD_X)) / stepX) : 0;
return clamp(i, 0, n – 1);
}
function show(i) {
if (i === activeIndex) return;
var reappearing = activeIndex === -1;
activeIndex = i;
guide.setAttribute("x1", xAt(i));
guide.setAttribute("x2", xAt(i));
guide.style.opacity = "1";
// Emphasize the hovered column's dots; reset the rest.
dotEls.forEach(function (col, si) {
col.forEach(function (c, ci) {
c.setAttribute("r", ci === i ? dotActiveR[si] : baseR[si]);
});
});
// Fill tooltip.
tipTitle.textContent = config.labels[i];
config.series.forEach(function (s, si) {
tipRows[si].textContent = config.formatValue(s.values[i]);
});
// Anchor above the highest point in this column.
var topSi = 0, topY = Infinity;
config.series.forEach(function (s, si) {
var yy = yAt(s.values[i]);
if (yy < topY) { topY = yy; topSi = si; }
});
var anchor = dotEls[topSi][i].getBoundingClientRect();
var rootRect = root.getBoundingClientRect();
var left = anchor.left + anchor.width / 2 – rootRect.left;
var top = anchor.top – rootRect.top – 12;
// On the first appearance, fade in exactly at the point: suppress the
// position ease so it doesn't slide in from its previous resting spot.
var suppress = reappearing && !reduceMotion();
if (suppress) tip.style.transition = "opacity 0.12s ease";
tip.setAttribute("data-visible", "true");
// Clamp horizontally within the container.
var halfW = tip.offsetWidth / 2;
left = clamp(left, halfW + 2, root.clientWidth – halfW – 2);
// Flip below the point if there's no room above.
if (top – tip.offsetHeight < 0) {
top = anchor.bottom – rootRect.top + 12;
tip.style.transform = "translate(-50%, 0)";
} else {
tip.style.transform = "translate(-50%, -100%)";
}
tip.style.left = left + "px";
tip.style.top = top + "px";
// Commit that position without animating, then restore the CSS
// transition so subsequent point-to-point moves ease into place.
if (suppress) {
void tip.offsetWidth;
tip.style.transition = "";
}
}
function hide() {
activeIndex = -1;
guide.style.opacity = "0";
tip.setAttribute("data-visible", "false");
dotEls.forEach(function (col, si) {
col.forEach(function (c) { c.setAttribute("r", baseR[si]); });
});
}
hit.addEventListener("pointermove", function (e) { show(indexFromClientX(e.clientX)); });
hit.addEventListener("pointerdown", function (e) { show(indexFromClientX(e.clientX)); });
hit.addEventListener("pointerleave", hide);
// Keyboard access.
svg.setAttribute("tabindex", "0");
svg.addEventListener("keydown", function (e) {
if (e.key === "ArrowRight" || e.key === "ArrowLeft") {
var start = activeIndex { title, lines:[…] } }
No printed value labels — values surface on hover (consistent with
the line chart). Bars use a single tunable color with rounded tops.
================================================================ */
renderers.bar = function (root, config) {
root.textContent = “”;
var barColor = (config.series && config.series[0] && config.series[0].color) || “#ff7b72”;
var barRadius = config.barRadius != null ? config.barRadius : 8;
// Per-bar fill: a bar may point at a different series (e.g. a muted
// “preliminary” color) via panel.barSeries[index]; otherwise series[0].
function barColorFor(panel, j) {
var si = (panel.barSeries && panel.barSeries[j] != null) ? panel.barSeries[j] : 0;
var s = config.series && config.series[si];
return (s && s.color) || barColor;
}
var motionMQ = window.matchMedia
? window.matchMedia(“(prefers-reduced-motion: reduce)”)
: null;
function reduceMotion() { return !!(motionMQ && motionMQ.matches); }
/* —- Title + divider (+ optional subtitle) —————— */
var title = html(“span”, “ghchart__title”);
title.textContent = config.title;
root.appendChild(title);
root.appendChild(html(“div”, “ghchart__rule”));
if (config.subtitle) {
var sub = html(“p”, “ghchart__subtitle”);
sub.textContent = config.subtitle;
root.appendChild(sub);
}
/* —- One shared tooltip for all panels ———————- */
var tip = html(“div”, “ghchart__tooltip”);
tip.setAttribute(“role”, “status”);
var tipTitle = html(“div”, “ghchart__tt-title”);
var tipBody = html(“div”, “ghchart__tt-body”);
tip.appendChild(tipTitle);
tip.appendChild(tipBody);
root.appendChild(tip);
var allBars = []; // { el, pi, bi }
var activeKey = null; // “pi:bi” of the hovered bar
function hideTip() {
activeKey = null;
tip.setAttribute(“data-visible”, “false”);
allBars.forEach(function (b) { b.el.style.opacity = “1”; });
}
// Hoisted: referenced by the per-column pointer handlers below.
function showTip(pi, bi, panel, panelBars) {
var reappearing = activeKey === null;
activeKey = pi + “:” + bi;
allBars.forEach(function (b) {
b.el.style.opacity = (b.pi === pi && b.bi === bi) ? “1” : “0.42”;
});
var content = panel.tooltip
? panel.tooltip(bi, panel)
: { title: (panel.labels || [])[bi],
lines: [ (panel.formatValue || String)(panel.values[bi]) ] };
tipTitle.textContent = content.title != null ? content.title : “”;
tipBody.textContent = “”;
(content.lines || []).forEach(function (ln) {
var row = html(“div”, “ghchart__tt-line”);
row.textContent = ln;
tipBody.appendChild(row);
});
var anchor = panelBars[bi].el.getBoundingClientRect();
var rootRect = root.getBoundingClientRect();
var left = anchor.left + anchor.width / 2 – rootRect.left;
var top = anchor.top – rootRect.top – 12;
var suppress = reappearing && !reduceMotion();
if (suppress) tip.style.transition = “opacity 0.12s ease”;
tip.setAttribute(“data-visible”, “true”);
var halfW = tip.offsetWidth / 2;
left = clamp(left, halfW + 2, root.clientWidth – halfW – 2);
if (top – tip.offsetHeight 0) {
for (var v = yMin; v <= yMax + 1e-9; v += step) {
var gy = yAt(v);
svg.appendChild(el("line", {
"class": "ghchart__gridline", x1: M.left, y1: gy, x2: VB.w – M.right, y2: gy
}));
var yl = el("text", {
"class": "ghchart__axislabel ghchart__axislabel–y",
x: M.left – 18, y: gy, dy: "0.32em", "text-anchor": "end"
});
yl.textContent = fmt(v);
svg.appendChild(yl);
}
}
// Solid baseline.
svg.appendChild(el("line", {
"class": "ghchart__axisline", x1: M.left, y1: baseY, x2: VB.w – M.right, y2: baseY
}));
// x-axis labels.
for (var i = 0; i < nb; i++) {
var xl = el("text", {
"class": "ghchart__axislabel ghchart__axislabel–x",
x: xCenter(i), y: VB.h – M.bottom + 30, "text-anchor": "middle"
});
if (panel.xLabelSize) xl.setAttribute("style", "font-size:" + panel.xLabelSize + "px");
xl.textContent = labels[i];
svg.appendChild(xl);
}
// Bars (rounded top corners only) + full-height hover columns.
var panelBars = [];
for (var j = 0; j dark ramp is derived from a single tunable base color.
================================================================ */
renderers.heatmap = function (root, config) {
root.textContent = “”;
var WHITE = [255, 255, 255], BLACK = [0, 0, 0];
function hexToRgb(h) {
h = String(h).replace(“#”, “”);
if (h.length === 3) h = h[0] + h[0] + h[1] + h[1] + h[2] + h[2];
return [parseInt(h.slice(0, 2), 16), parseInt(h.slice(2, 4), 16), parseInt(h.slice(4, 6), 16)];
}
function rgbToHex(c) {
return “#” + c.map(function (x) {
x = Math.max(0, Math.min(255, Math.round(x)));
return (x level 4 dark) from one hex.
function rampFrom(baseHex) {
var b = hexToRgb(baseHex);
return [
rgbToHex(mix(b, WHITE, 0.80)),
rgbToHex(mix(b, WHITE, 0.52)),
rgbToHex(mix(b, WHITE, 0.20)),
baseHex,
rgbToHex(mix(b, BLACK, 0.30))
];
}
function trim0(s) { return s.replace(/.0$/, “”); }
function fmtM(v) {
if (v >= 1000) { var g = v / 1000; return (g >= 10 ? Math.round(g) : trim0(g.toFixed(1))) + “B”; }
if (v >= 1) return trim0(v.toFixed(1)) + “M”;
return Math.round(v * 1000) + “K”;
}
var MON = [“Jan”, “Feb”, “Mar”, “Apr”, “May”, “Jun”, “Jul”, “Aug”, “Sep”, “Oct”, “Nov”, “Dec”];
var MON_FULL = [“January”, “February”, “March”, “April”, “May”, “June”,
“July”, “August”, “September”, “October”, “November”, “December”];
var WD = [“Sun”, “Mon”, “Tue”, “Wed”, “Thu”, “Fri”, “Sat”];
var year = config.year || 2026;
var startM = config.startMonth != null ? config.startMonth : 0;
var endM = config.endMonth != null ? config.endMonth : 5;
var emptyColor = config.emptyColor || “#ebedf0”;
function daysInMonth(y, m) { return new Date(y, m + 1, 0).getDate(); }
function parseISO(s) { var p = s.split(“-“); return new Date(+p[0], +p[1] – 1, +p[2]); }
function dayStart(dt) { return new Date(dt.getFullYear(), dt.getMonth(), dt.getDate()); }
/* —- Eyebrow + title + subtitle —————————– */
if (config.eyebrow) {
var eb = html(“div”, “ghheat__eyebrow”);
eb.appendChild(html(“span”, “ghheat__eyedot”));
var ebt = html(“span”, “ghheat__eyetext”);
ebt.textContent = config.eyebrow;
eb.appendChild(ebt);
root.appendChild(eb);
}
var title = html(“span”, “ghchart__title”);
title.textContent = config.title;
root.appendChild(title);
if (config.subtitle) {
var sub = html(“p”, “ghchart__subtitle ghheat__subtitle”);
sub.innerHTML = config.subtitle;
root.appendChild(sub);
}
/* —- One shared tooltip ————————————– */
var tip = html(“div”, “ghchart__tooltip”);
tip.setAttribute(“role”, “status”);
var tipTitle = html(“div”, “ghchart__tt-title”);
var tipBody = html(“div”, “ghchart__tt-body”);
tip.appendChild(tipTitle);
tip.appendChild(tipBody);
root.appendChild(tip);
var motionMQ = window.matchMedia ? window.matchMedia(“(prefers-reduced-motion: reduce)”) : null;
function reduceMotion() { return !!(motionMQ && motionMQ.matches); }
var activeCell = null;
function hideTip() { activeCell = null; tip.setAttribute(“data-visible”, “false”); }
function showTip(rectEl, titleText, lines) {
var reappearing = activeCell === null;
activeCell = rectEl;
tipTitle.textContent = titleText;
tipBody.textContent = “”;
lines.forEach(function (ln) {
var r = html(“div”, “ghchart__tt-line”);
r.innerHTML = ln;
tipBody.appendChild(r);
});
var a = rectEl.getBoundingClientRect(), rr = root.getBoundingClientRect();
var left = a.left + a.width / 2 – rr.left, top = a.top – rr.top – 12;
var suppress = reappearing && !reduceMotion();
if (suppress) tip.style.transition = “opacity 0.12s ease”;
tip.setAttribute(“data-visible”, “true”);
var halfW = tip.offsetWidth / 2;
left = clamp(left, halfW + 2, root.clientWidth – halfW – 2);
if (top – tip.offsetHeight < 0) {
top = a.bottom – rr.top + 12;
tip.style.transform = "translate(-50%, 0)";
} else {
tip.style.transform = "translate(-50%, -100%)";
}
tip.style.left = left + "px";
tip.style.top = top + "px";
if (suppress) { void tip.offsetWidth; tip.style.transition = ""; }
}
/* —- Panels ————————————————– */
(config.panels || []).forEach(function (panel, pi) {
var base = (config.series && config.series[pi] && config.series[pi].color) || panel.base || "#3094ff";
var ramp = rampFrom(base);
var strong = ramp[4];
var totals = panel.months || [];
var activeVals = [];
for (var mi = startM; mi <= endM; mi++) { if (totals[mi] != null) activeVals.push(totals[mi]); }
var vmin = activeVals.length ? Math.min.apply(null, activeVals) : 0;
var vmax = activeVals.length ? Math.max.apply(null, activeVals) : 1;
function levelFor(t) {
if (t == null) return -1;
if (vmax === vmin) return 4;
return Math.round((t – vmin) / (vmax – vmin) * 4);
}
var af = panel.activeFrom ? parseISO(panel.activeFrom) : new Date(year, startM, 1);
var at = panel.activeTo ? parseISO(panel.activeTo) : new Date(year, endM, daysInMonth(year, endM));
var wrap = html("div", "ghheat__panel");
var head = html("div", "ghheat__phead");
var badge = html("span", "ghheat__badge");
badge.textContent = panel.badge != null ? panel.badge : (pi + 1);
badge.style.background = strong;
head.appendChild(badge);
var pt = html("span", "ghheat__ptitle");
pt.textContent = panel.title;
head.appendChild(pt);
if (panel.descriptor) {
var pd = html("span", "ghheat__pdesc");
pd.textContent = panel.descriptor;
head.appendChild(pd);
}
wrap.appendChild(head);
var body = html("div", "ghheat__body");
/* —- Calendar grid (SVG) —- */
var gridStart = new Date(year, startM, 1);
var gs = new Date(gridStart);
gs.setDate(gs.getDate() – gs.getDay()); // back to Sunday
var gridEnd = new Date(year, endM, daysInMonth(year, endM));
var ge = new Date(gridEnd);
ge.setDate(ge.getDate() + (6 – ge.getDay())); // forward to Saturday
var nCols = Math.round((ge – gs) / (7 * 86400000)) + 1;
var cell = 13, sq = 11, rad = 2.5, labL = 34, labT = 18;
var W = labL + nCols * cell, H = labT + 7 * cell;
var svg = el("svg", {
"class": "ghheat__grid",
viewBox: "0 0 " + W + " " + H,
preserveAspectRatio: "xMinYMin meet",
role: "img",
"aria-label": panel.title + " calendar heatmap"
});
[1, 3, 5].forEach(function (r) {
var t = el("text", {
"class": "ghheat__wd", x: labL – 6, y: labT + r * cell + sq / 2,
dy: "0.32em", "text-anchor": "end"
});
t.textContent = WD[r];
svg.appendChild(t);
});
// Month labels above the column where each month begins.
for (var lm = startM; lm <= endM; lm++) {
var first = new Date(year, lm, 1);
var colOf = Math.floor((dayStart(first) – gs) / (7 * 86400000));
var mlab = el("text", { "class": "ghheat__month", x: labL + colOf * cell, y: 12, "text-anchor": "start" });
mlab.textContent = MON[lm];
svg.appendChild(mlab);
}
var afS = dayStart(af), atS = dayStart(at);
var d = new Date(gs);
for (var i = 0; i = startM && m = afS && ds = 0 ? ramp[lvl] : emptyColor
});
if (inRange) {
(function (dt, mm, has) {
var dateStr = WD[dt.getDay()] + ” u00b7 ” + MON[mm] + ” ” + dt.getDate() + “, ” + year;
var lines;
if (has) {
var daily = totals[mm] / daysInMonth(year, mm);
lines = [
“” + fmtM(daily) + “ ” + panel.legendLabel,
MON_FULL[mm] + ” u00b7 ” + fmtM(totals[mm]) + ” ” + panel.unitTotal
];
} else {
lines = [panel.emptyNote || “No vetted data”];
}
cellEl.addEventListener(“pointermove”, function () { showTip(cellEl, dateStr, lines); });
cellEl.addEventListener(“pointerdown”, function () { showTip(cellEl, dateStr, lines); });
cellEl.addEventListener(“pointerleave”, hideTip);
})(new Date(d), m, hasData);
} else {
cellEl.setAttribute(“class”, “ghheat__cell ghheat__cell–pad”);
}
svg.appendChild(cellEl);
d.setDate(d.getDate() + 1);
}
var gridwrap = html(“div”, “ghheat__gridwrap”);
gridwrap.appendChild(svg);
body.appendChild(gridwrap);
/* —- Side column: stat + note + legend + extra —- */
var side = html(“div”, “ghheat__side”);
if (panel.stat) {
var stat = html(“div”, “ghheat__stat”);
var big = html(“span”, “ghheat__statbig”);
big.textContent = panel.stat.big;
big.style.color = strong;
stat.appendChild(big);
if (panel.stat.small) {
var small = html(“span”, “ghheat__statsmall”);
small.textContent = panel.stat.small;
stat.appendChild(small);
}
side.appendChild(stat);
}
if (panel.note) {
var note = html(“p”, “ghheat__note”);
note.innerHTML = panel.note;
side.appendChild(note);
}
var leg = html(“div”, “ghheat__legend”);
var lw1 = html(“span”, “ghheat__legword”); lw1.textContent = “Fewer”; leg.appendChild(lw1);
ramp.forEach(function (c) {
var s = html(“span”, “ghheat__sw”); s.style.background = c; leg.appendChild(s);
});
var lw2 = html(“span”, “ghheat__legword”); lw2.textContent = “More”; leg.appendChild(lw2);
if (panel.legendLabel) {
var lu = html(“span”, “ghheat__legunit”); lu.textContent = “u00b7 ” + panel.legendLabel; leg.appendChild(lu);
}
side.appendChild(leg);
if (panel.extraNote) {
var ex = html(“div”, “ghheat__extra”);
var exsw = html(“span”, “ghheat__sw ghheat__sw–empty”);
exsw.style.background = emptyColor;
ex.appendChild(exsw);
var ext = html(“span”, “ghheat__extratext”);
ext.innerHTML = panel.extraNote;
ex.appendChild(ext);
side.appendChild(ex);
}
body.appendChild(side);
wrap.appendChild(body);
root.appendChild(wrap);
});
if (config.caption) {
var cap = html(“div”, “ghchart__caption”);
cap.innerHTML = config.caption;
root.appendChild(cap);
}
};
/* ================================================================
Scatter renderer — X/Y numeric plot with categorical points.
Used for cost-vs-quality benchmark charts: a highlighted “primary”
point (glow halo), a “reference” point with a dotted crosshair, and
muted “other” points. Values never print on the marks — a point’s
name shows for identity and the exact (y, x) reveals on hover.
================================================================ */
renderers.scatter = function (root, config) {
root.textContent = “”;
var uid = config.mountId;
var VB = { w: 1000, h: 600 };
var M = { top: 40, right: 30, bottom: 74, left: 96 };
var innerW = VB.w – M.left – M.right;
var innerH = VB.h – M.top – M.bottom;
var xa = config.xAxis, ya = config.yAxis;
var fmtX = xa.format || function (v) { return String(v); };
var fmtY = ya.format || function (v) { return String(v); };
var tipSuffix = config.tipSuffix || “”;
function xAt(v) { return M.left + innerW * (v – xa.min) / (xa.max – xa.min); }
function yAt(v) { return M.top + innerH * (1 – (v – ya.min) / (ya.max – ya.min)); }
var baseY = yAt(ya.min);
var motionMQ = window.matchMedia
? window.matchMedia(“(prefers-reduced-motion: reduce)”)
: null;
function reduceMotion() { return !!(motionMQ && motionMQ.matches); }
function colorOf(pt) {
var s = config.series && config.series[pt.series || 0];
return (s && s.color) || “#8c959f”;
}
/* —- Title (compact narrative headline, no rule) ———— */
var title = html(“div”, “ghchart__headline”);
title.textContent = config.title;
root.appendChild(title);
/* —- Header + legend (from series) ————————– */
if (!config.hideLegend) {
var header = html(“div”, “ghchart__header”);
var legend = html(“div”, “ghchart__legend”);
(config.series || []).forEach(function (s) {
var item = html(“span”, “ghchart__legend-item”);
var sw = html(“span”, “ghchart__swatch ghchart__swatch–dot”);
sw.style.background = s.color;
item.appendChild(sw);
item.appendChild(document.createTextNode(s.name));
legend.appendChild(item);
});
header.appendChild(legend);
root.appendChild(header);
}
/* —- SVG plot ———————————————– */
var svg = el(“svg”, {
“class”: “ghchart__plot ghchart__plot–scatter”,
viewBox: “0 0 ” + VB.w + ” ” + VB.h,
preserveAspectRatio: “xMidYMid meet”,
role: “img”,
“aria-label”: config.title + ” scatter plot”
});
// Gridlines (both directions) + tick labels.
var eps = 1e-6;
for (var yv = ya.min; yv <= ya.max + eps; yv += ya.step) {
var gy = yAt(yv);
svg.appendChild(el("line", {
"class": "ghchart__gridline",
x1: M.left, y1: gy, x2: VB.w – M.right, y2: gy
}));
var yl = el("text", {
"class": "ghchart__axislabel ghchart__axislabel–y",
x: M.left – 16, y: gy, dy: "0.32em", "text-anchor": "end"
});
yl.textContent = fmtY(yv);
svg.appendChild(yl);
}
for (var xv = xa.min; xv <= xa.max + eps; xv += xa.step) {
var gx = xAt(xv);
svg.appendChild(el("line", {
"class": "ghchart__gridline ghchart__gridline–v",
x1: gx, y1: M.top, x2: gx, y2: baseY
}));
var isFirst = Math.abs(xv – xa.min) < eps;
var isLast = Math.abs(xv – xa.max) < eps;
var xl = el("text", {
"class": "ghchart__axislabel ghchart__axislabel–x",
x: gx, y: baseY + 34,
"text-anchor": isFirst ? "start" : (isLast ? "end" : "middle")
});
xl.textContent = fmtX(xv);
svg.appendChild(xl);
}
// Axis titles.
if (xa.title) {
var xt = el("text", {
"class": "ghchart__axistitle",
x: M.left + innerW / 2, y: VB.h – 12, "text-anchor": "middle"
});
xt.textContent = xa.title;
svg.appendChild(xt);
}
if (ya.title) {
var ytX = 24, ytY = M.top + innerH / 2;
var yt = el("text", {
"class": "ghchart__axistitle",
x: ytX, y: ytY, "text-anchor": "middle",
transform: "rotate(-90 " + ytX + " " + ytY + ")"
});
yt.textContent = ya.title;
svg.appendChild(yt);
}
// Reference crosshair through the flagged point (dual dotted lines).
var refPt = (config.points || []).filter(function (p) { return p.reference; })[0];
if (refPt) {
var rColor = colorOf(refPt);
var rx = xAt(refPt.x), ry = yAt(refPt.y);
svg.appendChild(el("line", {
"class": "ghchart__crosshair",
x1: rx, y1: M.top, x2: rx, y2: baseY, stroke: rColor
}));
svg.appendChild(el("line", {
"class": "ghchart__crosshair",
x1: M.left, y1: ry, x2: VB.w – M.right, y2: ry, stroke: rColor
}));
}
// Points: halo (highlight/reference) + dot + name label.
var dotEls = [], hitEls = [];
(config.points || []).forEach(function (pt, i) {
var cx = xAt(pt.x), cy = yAt(pt.y), c = colorOf(pt);
var big = pt.highlight || pt.reference;
if (big) {
svg.appendChild(el("circle", {
"class": "ghchart__halo", cx: cx, cy: cy, r: 17, fill: c
}));
}
var dot = el("circle", {
"class": "ghchart__pt", cx: cx, cy: cy,
r: big ? 9 : 5.5, fill: c
});
svg.appendChild(dot);
dotEls.push({ el: dot, baseR: big ? 9 : 5.5 });
// Name label — bold+colored for the story points, muted for the rest.
var pos = pt.labelPos || (pt.highlight ? "below" : pt.reference ? "above" : "right");
var dx = 0, dy = 0, anchor = "middle";
var gap = big ? 15 : 9;
if (pos === "right") { dx = gap + 4; dy = 5; anchor = "start"; }
else if (pos === "left") { dx = -(gap + 4); dy = 5; anchor = "end"; }
else if (pos === "above") { dy = -(gap + 6); anchor = "middle"; }
else { dy = gap + 16; anchor = "middle"; } // below
var lbl = el("text", {
"class": "ghchart__pt-label" + (big ? " ghchart__pt-label–strong" : ""),
x: cx + dx, y: cy + dy, "text-anchor": anchor,
fill: big ? c : null
});
lbl.textContent = pt.label;
svg.appendChild(lbl);
// Transparent hit target for hover/focus.
var hit = el("circle", {
"class": "ghchart__pthit", cx: cx, cy: cy, r: 20,
tabindex: "0", role: "img",
"aria-label": pt.label + ": " + fmtY(pt.y) + ", " + fmtX(pt.x) + tipSuffix
});
svg.appendChild(hit);
hitEls.push(hit);
});
root.appendChild(svg);
/* —- Tooltip (title + free lines) ————————— */
var tip = html("div", "ghchart__tooltip");
tip.setAttribute("role", "status");
var tipTitle = html("div", "ghchart__tt-title");
var tipBody = html("div", "ghchart__tt-body");
tip.appendChild(tipTitle);
tip.appendChild(tipBody);
root.appendChild(tip);
var activeIndex = -1;
function show(i) {
var pt = config.points[i];
if (!pt) return;
var reappearing = activeIndex === -1;
activeIndex = i;
dotEls.forEach(function (d, di) {
d.el.setAttribute("r", di === i ? d.baseR + 2.5 : d.baseR);
});
tipTitle.textContent = pt.label;
tipBody.textContent = "";
var line = html("div", "ghchart__tt-line");
line.textContent = fmtY(pt.y) + " · " + fmtX(pt.x) + tipSuffix;
tipBody.appendChild(line);
var anchor = dotEls[i].el.getBoundingClientRect();
var rootRect = root.getBoundingClientRect();
var left = anchor.left + anchor.width / 2 – rootRect.left;
var top = anchor.top – rootRect.top – 12;
var suppress = reappearing && !reduceMotion();
if (suppress) tip.style.transition = "opacity 0.12s ease";
tip.setAttribute("data-visible", "true");
var halfW = tip.offsetWidth / 2;
left = clamp(left, halfW + 2, root.clientWidth – halfW – 2);
if (top – tip.offsetHeight 0) {
svg.appendChild(el(“line”, {
“class”: “ghchart__phase-sep”, x1: x0, y1: M.top, x2: x0, y2: baseY
}));
}
var pl = el(“text”, {
“class”: “ghchart__phase-label”, x: (x0 + x1) / 2, y: M.top – 40,
“text-anchor”: “middle”
});
pl.textContent = ph.label;
svg.appendChild(pl);
if (ph.avg) {
var pa = el(“text”, {
“class”: “ghchart__phase-avg”, x: (x0 + x1) / 2, y: M.top + 24,
“text-anchor”: “middle”, fill: cPoint
});
pa.textContent = ph.avg;
svg.appendChild(pa);
}
});
// Horizontal gridlines + y tick labels (skip a gridline at the reference y).
var refY = config.reference ? config.reference.y : null;
(ya.ticks || []).forEach(function (tv) {
var gy = yAt(tv);
if (refY === null || Math.abs(tv – refY) > 1e-9) {
svg.appendChild(el(“line”, {
“class”: “ghchart__gridline”, x1: M.left, y1: gy, x2: VB.w – M.right, y2: gy
}));
}
var yl = el(“text”, {
“class”: “ghchart__axislabel ghchart__axislabel–y”,
x: M.left – 16, y: gy, dy: “0.32em”, “text-anchor”: “end”
});
yl.textContent = fmtY(tv);
svg.appendChild(yl);
});
// X tick labels (dated).
(xa.ticks || []).forEach(function (t) {
var gx = xAt(t.at);
var first = Math.abs(t.at – xa.min) < 1e-9, last = Math.abs(t.at – xa.max) < 1e-9;
var xl = el("text", {
"class": "ghchart__axislabel ghchart__axislabel–x",
x: gx, y: baseY + 30, "text-anchor": first ? "start" : (last ? "end" : "middle")
});
xl.textContent = t.text;
svg.appendChild(xl);
});
// Axis titles.
if (ya.title) {
var ytX = 22, ytY = M.top + innerH / 2;
var yt = el("text", {
"class": "ghchart__axistitle", x: ytX, y: ytY, "text-anchor": "middle",
transform: "rotate(-90 " + ytX + " " + ytY + ")"
});
yt.textContent = ya.title;
svg.appendChild(yt);
}
// Trend: optional ±band (linear only), then the dashed line + slope label.
var tr = config.trend;
if (tr) {
function trendY(x) {
return tr.from.y + (tr.to.y – tr.from.y) * (x – tr.from.x) / (tr.to.x – tr.from.x);
}
if (tr.band && !isLog) {
var p = tr.band;
var pts = [
[xAt(tr.from.x), yAt(trendY(tr.from.x) + p)],
[xAt(tr.to.x), yAt(trendY(tr.to.x) + p)],
[xAt(tr.to.x), yAt(trendY(tr.to.x) – p)],
[xAt(tr.from.x), yAt(trendY(tr.from.x) – p)]
].map(function (a) { return a[0] + "," + a[1]; }).join(" ");
svg.appendChild(el("polygon", {
"class": "ghchart__trendband", points: pts, fill: cTrend
}));
}
svg.appendChild(el("line", {
"class": "ghchart__trendline",
x1: xAt(tr.from.x), y1: yAt(tr.from.y),
x2: xAt(tr.to.x), y2: yAt(tr.to.y), stroke: cTrend
}));
if (tr.label) {
var lx, lyy;
if (tr.labelAt) { lx = xAt(tr.labelAt.x); lyy = yAt(tr.labelAt.y); }
else {
lx = xAt(tr.to.x) + (tr.labelDX == null ? -6 : tr.labelDX);
lyy = yAt(tr.to.y) + (tr.labelDY == null ? -12 : tr.labelDY);
}
var sl = el("text", {
"class": "ghchart__slope", x: lx, y: lyy,
"text-anchor": tr.labelAnchor || "end", fill: cTrend
});
sl.textContent = tr.label;
svg.appendChild(sl);
}
}
// Reference line (horizontal dashed) + right-aligned label.
if (config.reference) {
var rc = config.reference.color || "#24292f";
var ryy = yAt(config.reference.y);
svg.appendChild(el("line", {
"class": "ghchart__refline", x1: M.left, y1: ryy, x2: VB.w – M.right, y2: ryy,
stroke: rc
}));
if (config.reference.label) {
var rl = el("text", {
"class": "ghchart__reflabel", x: VB.w – M.right, y: ryy – 8,
"text-anchor": "end", fill: rc
});
rl.textContent = config.reference.label;
svg.appendChild(rl);
}
}
// Data squares (values reveal on hover only).
var side = 13, hSide = side / 2;
var sqEls = [], hitEls = [];
(config.points || []).forEach(function (pt, i) {
var cx = xAt(pt.x), cy = yAt(pt.y);
var sq = el("rect", {
"class": "ghchart__square", x: cx – hSide, y: cy – hSide,
width: side, height: side, rx: 2, fill: cPoint
});
svg.appendChild(sq);
sqEls.push({ el: sq, cx: cx, cy: cy });
// Hover/focus hit target — omitted when hover is disabled so the
// (illustrative) point values never surface, on screen or to a11y.
if (!config.disableHover) {
var hit = el("rect", {
"class": "ghchart__squarehit", x: cx – 13, y: cy – 13,
width: 26, height: 26, tabindex: "0", role: "img",
"aria-label": (pt.d || "") + " " + fmtY(pt.y)
});
svg.appendChild(hit);
hitEls.push(hit);
}
});
// Invalid-run markers: red diamond + X, leader line, annotation text.
(config.invalids || []).forEach(function (iv) {
var cx = xAt(iv.x), cy = yAt(iv.y);
svg.appendChild(el("rect", {
"class": "ghchart__invalid", x: cx – hSide, y: cy – hSide,
width: side, height: side, rx: 1.5, fill: "none", stroke: cInvalid,
transform: "rotate(45 " + cx + " " + cy + ")"
}));
var q = 3.4;
svg.appendChild(el("line", {
"class": "ghchart__invalid-x", x1: cx – q, y1: cy – q, x2: cx + q, y2: cy + q,
stroke: cInvalid
}));
svg.appendChild(el("line", {
"class": "ghchart__invalid-x", x1: cx – q, y1: cy + q, x2: cx + q, y2: cy – q,
stroke: cInvalid
}));
if (iv.title) {
var tx = cx + (iv.labelDX == null ? 16 : iv.labelDX);
var ty = cy + (iv.labelDY == null ? -26 : iv.labelDY);
svg.appendChild(el("line", {
"class": "ghchart__leader", x1: cx, y1: cy, x2: tx, y2: ty, stroke: cInvalid
}));
var anchor = iv.labelAnchor || "start";
var at = el("text", {
"class": "ghchart__anno-title", x: tx, y: ty – 4, "text-anchor": anchor, fill: cInvalid
});
at.textContent = iv.title;
svg.appendChild(at);
if (iv.sub) {
var asu = el("text", {
"class": "ghchart__anno-sub", x: tx, y: ty + 11, "text-anchor": anchor
});
asu.textContent = iv.sub;
svg.appendChild(asu);
}
}
});
// Bracket annotation (span with end ticks + centered label above).
(config.brackets || []).forEach(function (b) {
var x0 = xAt(b.fromX), x1 = xAt(b.toX), by = yAt(b.y);
svg.appendChild(el("line", {
"class": "ghchart__bracket", x1: x0, y1: by, x2: x1, y2: by
}));
svg.appendChild(el("line", { "class": "ghchart__bracket", x1: x0, y1: by, x2: x0, y2: by + 7 }));
svg.appendChild(el("line", { "class": "ghchart__bracket", x1: x1, y1: by, x2: x1, y2: by + 7 }));
var bl = el("text", {
"class": "ghchart__bracket-label", x: (x0 + x1) / 2, y: by – 8, "text-anchor": "middle"
});
bl.textContent = b.text;
svg.appendChild(bl);
});
// Final callout: ringed point + leader + title/sub placed inside the plot.
if (config.callout) {
var co = config.callout;
var ccx = xAt(co.x), ccy = yAt(co.y);
svg.appendChild(el("circle", {
"class": "ghchart__callout-ring", cx: ccx, cy: ccy, r: 12, stroke: cPoint
}));
var ctx = ccx + (co.labelDX == null ? -16 : co.labelDX);
var cty = ccy + (co.labelDY == null ? -30 : co.labelDY);
svg.appendChild(el("line", {
"class": "ghchart__leader ghchart__leader–callout", x1: ccx, y1: ccy, x2: ctx, y2: cty,
stroke: cPoint
}));
var can = co.labelAnchor || "end";
var ct = el("text", {
"class": "ghchart__anno-title ghchart__anno-title–callout", x: ctx, y: cty – 4, "text-anchor": can, fill: cPoint
});
ct.textContent = co.title;
svg.appendChild(ct);
if (co.sub) {
var cs = el("text", {
"class": "ghchart__anno-sub ghchart__anno-sub–callout", x: ctx, y: cty + 12, "text-anchor": can
});
cs.textContent = co.sub;
svg.appendChild(cs);
}
}
root.appendChild(svg);
if (config.caption) {
var cap = html("div", "ghchart__caption");
cap.textContent = config.caption;
root.appendChild(cap);
}
/* —- Tooltip + hover interaction (skipped when disabled) —— */
if (!config.disableHover) {
var tip = html("div", "ghchart__tooltip");
tip.setAttribute("role", "status");
var tipTitle = html("div", "ghchart__tt-title");
var tipBody = html("div", "ghchart__tt-body");
tip.appendChild(tipTitle);
tip.appendChild(tipBody);
root.appendChild(tip);
var activeIndex = -1;
function show(i) {
var pt = config.points[i];
if (!pt) return;
var reappearing = activeIndex === -1;
activeIndex = i;
sqEls.forEach(function (s, si) {
var big = si === i;
var w = big ? side + 5 : side;
s.el.setAttribute("width", w);
s.el.setAttribute("height", w);
s.el.setAttribute("x", s.cx – w / 2);
s.el.setAttribute("y", s.cy – w / 2);
});
var tipInfo = config.pointTip
? config.pointTip(pt)
: { title: pt.d || "", line: fmtY(pt.y) };
tipTitle.textContent = tipInfo.title;
tipBody.textContent = "";
var line = html("div", "ghchart__tt-line");
line.textContent = tipInfo.line;
tipBody.appendChild(line);
var anchor = sqEls[i].el.getBoundingClientRect();
var rootRect = root.getBoundingClientRect();
var left = anchor.left + anchor.width / 2 – rootRect.left;
var top = anchor.top – rootRect.top – 12;
var suppress = reappearing && !reduceMotion();
if (suppress) tip.style.transition = "opacity 0.12s ease";
tip.setAttribute("data-visible", "true");
var halfW = tip.offsetWidth / 2;
left = clamp(left, halfW + 2, root.clientWidth – halfW – 2);
if (top – tip.offsetHeight < 0) {
top = anchor.bottom – rootRect.top + 12;
tip.style.transform = "translate(-50%, 0)";
} else {
tip.style.transform = "translate(-50%, -100%)";
}
tip.style.left = left + "px";
tip.style.top = top + "px";
if (suppress) { void tip.offsetWidth; tip.style.transition = ""; }
}
function hide() {
activeIndex = -1;
tip.setAttribute("data-visible", "false");
sqEls.forEach(function (s) {
s.el.setAttribute("width", side);
s.el.setAttribute("height", side);
s.el.setAttribute("x", s.cx – hSide);
s.el.setAttribute("y", s.cy – hSide);
});
}
hitEls.forEach(function (hit, i) {
hit.addEventListener("pointerenter", function () { show(i); });
hit.addEventListener("pointermove", function () { show(i); });
hit.addEventListener("pointerleave", hide);
hit.addEventListener("focus", function () { show(i); });
hit.addEventListener("blur", hide);
});
}
};
/* ================================================================
Distribution dashboard renderer
—————————————————————-
A composition figure (no hover — every value is printed as text, so
the marks are inherently screen-reader accessible):
• a compact narrative headline + muted subtitle;
• an optional segmented "mix" bar — proportional colored segments,
each with its name inside and count/percent below;
• one or more panels of ranked horizontal bars, each row printing
its category (left), a bar, and its count/percent (right).
Colors come from config.series so the harness can tune them live:
series[0] = bar fill (single base hex);
series[1..] = segment fills, in the order of config.segments.items.
================================================================ */
renderers.distribution = function (root, config) {
root.textContent = "";
root.setAttribute("role", "img");
if (config.title) root.setAttribute("aria-label", config.title);
var series = config.series || [];
var barColor = (series[0] && series[0].color) || "#8250df";
var total = config.total ||
(config.segments && config.segments.items
? config.segments.items.reduce(function (a, b) { return a + b.value; }, 0)
: 0);
function pctText(v) {
if (!total) return "";
return (Math.round((v / total) * 1000) / 10).toFixed(1) + "%";
}
function valueHTML(v) {
var p = pctText(v);
return "” + v + “” + (p ? ” (” + p + “)” : “”);
}
/* —- Headline + subtitle ————————————- */
if (config.title) {
var head = html(“div”, “ghchart__headline”);
head.textContent = config.title;
root.appendChild(head);
}
if (config.subtitle) {
var sub = html(“p”, “ghchart__subtitle”);
sub.textContent = config.subtitle;
root.appendChild(sub);
}
/* —- Segmented “mix” bar ————————————– */
var seg = config.segments;
if (seg && seg.items && seg.items.length) {
var segSec = html(“div”, “ghchart__dist-section”);
if (seg.title) {
var segTitle = html(“div”, “ghchart__panel-title”);
segTitle.textContent = seg.title;
segSec.appendChild(segTitle);
}
var segTotal = seg.items.reduce(function (a, b) { return a + b.value; }, 0) || 1;
var bar = html(“div”, “ghchart__seg”);
var notes = html(“div”, “ghchart__seg-note-row”);
seg.items.forEach(function (it, i) {
var basis = (it.value / segTotal) * 100;
var col = (series[i + 1] && series[i + 1].color) || it.color || barColor;
var cell = html(“div”, “ghchart__seg-cell”);
cell.style.flex = “0 0 ” + basis + “%”;
cell.style.background = col;
cell.textContent = it.label;
bar.appendChild(cell);
var note = html(“div”, “ghchart__seg-note”);
note.style.flex = “0 0 ” + basis + “%”;
note.innerHTML = valueHTML(it.value);
notes.appendChild(note);
});
segSec.appendChild(bar);
segSec.appendChild(notes);
root.appendChild(segSec);
}
/* —- Ranked bar panels (grid: 2-up, stacking on narrow) —— */
var panels = config.panels || [];
if (panels.length) {
var cols = html(“div”, “ghchart__dist-cols”);
if (config.columns === 1 || panels.length === 1) {
cols.classList.add(“ghchart__dist-cols–stack”);
}
panels.forEach(function (panel) {
var sec = html(“div”, “ghchart__dist-section”);
if (panel.title) {
var pt = html(“div”, “ghchart__panel-title”);
pt.textContent = panel.title;
sec.appendChild(pt);
}
var list = html(“div”, “ghchart__dist-list”);
var pmax = (panel.items || []).reduce(function (m, it) {
return it.value > m ? it.value : m;
}, 0) || 1;
(panel.items || []).forEach(function (it) {
var row = html(“div”, “ghchart__dist-row”);
var cat = html(“div”, “ghchart__dist-cat”);
cat.textContent = it.label;
row.appendChild(cat);
var track = html(“div”, “ghchart__dist-track”);
var b = html(“div”, “ghchart__dist-bar”);
b.style.width = Math.max((it.value / pmax) * 100, 1.2) + “%”;
b.style.background = it.color || barColor;
track.appendChild(b);
row.appendChild(track);
var val = html(“div”, “ghchart__dist-val”);
val.innerHTML = valueHTML(it.value);
row.appendChild(val);
list.appendChild(row);
});
sec.appendChild(list);
cols.appendChild(sec);
});
root.appendChild(cols);
}
/* —- Caption / footnote ————————————– */
if (config.caption) {
var cap = html(“div”, “ghchart__caption”);
cap.innerHTML = config.caption;
root.appendChild(cap);
}
};
/* ================================================================
Dispatcher — pick a renderer by config.type and draw into a mount
================================================================ */
function render(config, mountEl) {
var root = mountEl || document.getElementById(config.mountId);
if (!root) return;
root.classList.add(“ghchart”);
/* Resolve the renderer from the SHARED registry (see registration below),
not this bundle’s private `renderers`. When several exported charts share
one page they all merge into one registry, so every chart finds its
renderer even if an older engine bundle loaded first. */
var reg = (global.GHChartEngine && global.GHChartEngine.renderers) || renderers;
var fn = reg[config.type] || renderers[config.type] || reg.line || renderers.line;
fn(root, config);
}
/* —————————————————————-
Shared-engine registration (multi-embed safe)
—————————————————————-
Every exported chart.js embeds this whole engine. When two or more
charts are placed on the same page (e.g. a WordPress post), we must NOT
let the first-loaded bundle silently win — an older bundle would be
missing renderers added later (this is why a heatmap pasted after an
older bar chart used to vanish).
Instead we keep ONE shared engine:
• every bundle merges in any renderers the shared registry lacks;
• the newest bundle (highest ENGINE_VERSION) provides render(), which
reads renderers from the shared registry at call time.
The result is order-independent and resilient to version skew as new
chart types are added. Bump ENGINE_VERSION whenever renderers or render
change so a newer embed upgrades an older shared engine in place. */
var ENGINE_VERSION = 9;
var existing = global.GHChartEngine;
if (existing && typeof existing.version === “number”) {
if (ENGINE_VERSION > existing.version) {
/* This bundle is newer. Every export embeds the COMPLETE engine, so this
bundle’s `renderers` is a self-contained, up-to-date set. Adopt it as
the shared registry (upgrading older same-named renderers in place),
while defensively preserving any renderer types only the older engine
happened to have. Then take over render(). */
for (var ek in existing.renderers) {
if (Object.prototype.hasOwnProperty.call(existing.renderers, ek) && !renderers[ek]) {
renderers[ek] = existing.renderers[ek];
}
}
existing.renderers = renderers;
existing.render = render;
existing.version = ENGINE_VERSION;
} else {
/* Same or older version already present: only contribute renderer types
the shared registry is missing (don’t clobber an equal/newer engine). */
for (var rk in renderers) {
if (Object.prototype.hasOwnProperty.call(renderers, rk) && !existing.renderers[rk]) {
existing.renderers[rk] = renderers[rk];
}
}
}
} else {
/* No engine yet, or a pre-versioning (old-style) engine loaded first.
Take over, preserving any renderers the old-style engine registered. */
if (existing && existing.renderers) {
for (var ok in existing.renderers) {
if (Object.prototype.hasOwnProperty.call(existing.renderers, ok) && !renderers[ok]) {
renderers[ok] = existing.renderers[ok];
}
}
}
global.GHChartEngine = { renderers: renderers, render: render, version: ENGINE_VERSION };
}
})(typeof window !== “undefined” ? window : this);
;(function () {
“use strict”;
var CONFIG = {
mountId: “gh-chart-hf-terminal”,
type: “scatter”,
title: “TerminalBench 2.1 – GitHub Copilot CLI”,
xAxis: {
min: 0,
max: 1,
step: 0.2,
title: “Mean cost per task (USD)”,
format: function (v) { return “$” + v.toFixed(2); }
},
yAxis: {
min: 50,
max: 90,
step: 10,
title: “Resolution rate (pass@1)”,
format: function (v) { return v + “%”; }
},
tipSuffix: “/task”,
series: [
{
name: “HydraFusion”,
color: “#2da44f”
},
{
name: “Opus 5 (reference)”,
color: “#8250df”
},
{
name: “Other solo models”,
color: “#8c959f”
}
],
points: [
{
label: “HydraFusion”,
x: 0.3,
y: 84.7,
series: 0,
highlight: true,
labelPos: “above”
},
{
label: “Opus 5”,
x: 0.9,
y: 79.8,
series: 1,
reference: true,
labelPos: “above”
},
{
label: “Sonnet 5”,
x: 0.55,
y: 76,
series: 2,
labelPos: “right”
},
{
label: “GPT-5.6-Sol”,
x: 0.3,
y: 73.3,
series: 2,
labelPos: “right”
},
{
label: “GPT-5.6-Terra”,
x: 0.25,
y: 72.5,
series: 2,
labelPos: “left”
},
{
label: “GPT-5.6-Luna”,
x: 0.03,
y: 56,
series: 2,
labelPos: “right”
}
]
};
function boot() {
var root = document.getElementById(CONFIG.mountId);
if (!root || root.getAttribute(“data-gh-rendered”)) return;
root.setAttribute(“data-gh-rendered”, “1”);
window.GHChartEngine.render(CONFIG);
}
if (document.readyState === “loading”) {
document.addEventListener(“DOMContentLoaded”, boot);
} else {
boot();
}
})();
DeepSWE
DeepSWE evaluates challenging repository-level software engineering tasks that require navigating large codebases, understanding cross-file dependencies, and producing end-to-end fixes. On this benchmark, HydraFusion comes within 1.5 percentage points of Opus 5 while reducing cost by 36%, demonstrating a compelling quality-cost tradeoff for complex real-world engineering tasks.
.ghchart {
/* Theme tokens */
–ghc-text: #1f2328;
–ghc-muted: #656d76;
–ghc-grid: #d0d7de;
–ghc-axis: #59636e;
–ghc-card-bg: #ffffff;
–ghc-card-border: #d0d7de;
–ghc-divider: #b6bfb8;
–ghc-guide: #afb8c1;
/* GitHub brand font — matches the github.blog stack (Mona Sans, with
the blog’s metric fallback) so it renders identically in-context. */
font-family: “Mona Sans”, “Mona Sans Fallback”, -apple-system, “system-ui”,
“Segoe UI”, Helvetica, Arial, sans-serif;
-webkit-font-smoothing: antialiased;
text-rendering: optimizeLegibility;
position: relative;
box-sizing: border-box;
width: 100%;
max-width: 699px;
margin: 0 auto;
color: var(–ghc-text);
line-height: 1.4;
}
.ghchart *,
.ghchart *::before,
.ghchart *::after { box-sizing: border-box; }
/* —————————————————————— */
/* Header + legend */
/* —————————————————————— */
.ghchart__header {
display: flex;
justify-content: flex-end;
align-items: center;
min-height: 24px;
margin-bottom: 4px;
}
.ghchart__legend {
display: flex;
align-items: center;
gap: 20px;
flex-wrap: wrap;
justify-content: flex-end;
}
.ghchart__legend-item {
display: inline-flex;
align-items: center;
gap: 8px;
font-size: clamp(14px, 1.9vw, 17px);
font-weight: 600;
color: var(–ghc-muted);
white-space: nowrap;
}
.ghchart__swatch {
width: 14px;
height: 14px;
border-radius: 4px;
flex: 0 0 auto;
}
/* —————————————————————— */
/* Plot (SVG) */
/* —————————————————————— */
.ghchart__plot {
display: block;
width: 100%;
height: auto;
overflow: visible;
touch-action: pan-y;
}
.ghchart__gridline {
stroke: var(–ghc-grid);
stroke-width: 1;
stroke-dasharray: 2 6;
stroke-linecap: round;
opacity: 0.9;
}
.ghchart__axislabel {
fill: var(–ghc-axis);
font-size: 22px;
font-weight: 500;
}
.ghchart__axislabel–x { font-weight: 600; }
.ghchart__line {
fill: none;
stroke-linecap: round;
stroke-linejoin: round;
}
.ghchart__dot { transition: r 0.12s ease; }
/* Dashed threshold line (e.g. a target/reference level) + floating label.
Stroke color is set inline per chart; dash + label styling live here. */
.ghchart__threshold {
stroke-width: 2;
stroke-dasharray: 7 6;
stroke-linecap: round;
opacity: 0.9;
}
.ghchart__threshold-label {
font-size: 20px;
font-weight: 700;
letter-spacing: -0.01em;
}
/* Hatched band marking a partial / projected trailing region. */
.ghchart__projection { pointer-events: none; }
.ghchart__guide {
stroke: var(–ghc-guide);
stroke-width: 1.5;
stroke-dasharray: 4 4;
opacity: 0;
transition: opacity 0.12s ease;
}
.ghchart__hit { fill: transparent; }
/* —————————————————————— */
/* Scatter plot */
/* —————————————————————— */
.ghchart__gridline–v { /* vertical gridlines reuse the dashed grid style */ }
.ghchart__axistitle {
fill: var(–ghc-muted);
font-size: 20px;
font-weight: 600;
letter-spacing: -0.01em;
}
/* Dotted reference crosshair through the “reference” point. Stroke color
is set inline (tracks the reference series color). */
.ghchart__crosshair {
stroke-width: 2;
stroke-dasharray: 2 7;
stroke-linecap: round;
opacity: 0.85;
pointer-events: none;
}
.ghchart__halo { opacity: 0.18; pointer-events: none; }
.ghchart__pt { transition: r 0.12s ease; }
.ghchart__pt-label {
fill: var(–ghc-muted);
font-size: 19px;
font-weight: 600;
letter-spacing: -0.01em;
pointer-events: none;
}
.ghchart__pt-label–strong { font-size: 21px; font-weight: 700; }
.ghchart__pthit { fill: transparent; cursor: default; outline: none; }
.ghchart__pthit:focus-visible {
outline: 2px solid var(–ghc-axis);
outline-offset: 1px;
}
.ghchart__swatch–dot { border-radius: 50%; }
/* —————————————————————— */
/* Trend chart (dated time-series with narrative headline) */
/* —————————————————————— */
.ghchart__headline {
font-size: clamp(17px, 2.3vw, 20px);
line-height: 1.32;
font-weight: 700;
letter-spacing: -0.01em;
color: var(–ghc-text);
margin: 0 0 8px;
}
/* Trend legend sits left-aligned under the headline/subtitle. */
.ghchart__legend–trend {
justify-content: flex-start;
margin: 2px 0 14px;
}
.ghchart__glyph { flex: 0 0 auto; }
.ghchart__glyph–square {
width: 13px; height: 13px; border-radius: 2px;
}
.ghchart__glyph–diamond {
width: 12px; height: 12px; border: 1.5px solid; transform: rotate(45deg);
}
.ghchart__glyph–line {
width: 20px; height: 0; border-top: 2px dashed; border-radius: 0;
}
/* Phase background columns + separators + top labels. */
.ghchart__phase { fill: #f6f8fa; opacity: 0.55; }
.ghchart__phase–alt { fill: #ffffff; opacity: 0; }
.ghchart__phase-sep {
stroke: var(–ghc-grid); stroke-width: 1; stroke-dasharray: 2 5; opacity: 0.8;
}
.ghchart__phase-label {
fill: var(–ghc-muted);
font-size: 15px;
font-weight: 700;
letter-spacing: 0.06em;
}
.ghchart__phase-avg {
font-size: 16px;
font-weight: 700;
letter-spacing: -0.01em;
}
/* Dashed trend line + ± noise band + slope label. */
.ghchart__trendband { opacity: 0.12; pointer-events: none; }
.ghchart__trendline {
stroke-width: 2.5;
stroke-dasharray: 8 6;
stroke-linecap: round;
fill: none;
}
.ghchart__slope {
font-size: 20px;
font-weight: 700;
letter-spacing: -0.01em;
}
/* Horizontal reference line + label. */
.ghchart__refline {
stroke-width: 2;
stroke-dasharray: 7 6;
stroke-linecap: round;
opacity: 0.85;
}
.ghchart__reflabel {
font-size: 16px;
font-weight: 700;
letter-spacing: -0.01em;
}
/* Data squares — values reveal on hover only. */
.ghchart__square { transition: width 0.12s ease, height 0.12s ease, x 0.12s ease, y 0.12s ease; }
.ghchart__squarehit { fill: transparent; cursor: default; outline: none; }
.ghchart__squarehit:focus-visible {
outline: 2px solid var(–ghc-axis);
outline-offset: 1px;
}
/* Invalid-run markers + leader-line annotations. */
.ghchart__invalid { stroke-width: 2; }
.ghchart__invalid-x { stroke-width: 2; stroke-linecap: round; }
.ghchart__leader { stroke-width: 1; stroke-dasharray: 2 3; opacity: 0.8; }
.ghchart__leader–callout { stroke-dasharray: none; opacity: 0.6; }
.ghchart__anno-title {
font-size: 15px;
font-weight: 700;
letter-spacing: -0.01em;
}
.ghchart__anno-sub {
fill: var(–ghc-muted);
font-size: 13px;
font-weight: 500;
}
/* Final-callout labels read a touch larger than the invalid-run notes. */
.ghchart__anno-title–callout { font-size: 17px; }
.ghchart__anno-sub–callout { font-size: 14px; }
/* Bracket span annotation. */
.ghchart__bracket { stroke: var(–ghc-axis); stroke-width: 1.5; opacity: 0.75; }
.ghchart__bracket-label {
fill: var(–ghc-muted);
font-size: 13px;
font-weight: 700;
letter-spacing: 0.04em;
}
/* Final callout ring. */
.ghchart__callout-ring { fill: none; stroke-width: 2; }
/* —————————————————————— */
/* Title + divider */
/* —————————————————————— */
.ghchart__title {
/* Matches the github.blog H2 (.wp-block-heading) exactly */
display: block;
font-size: 32px;
line-height: 40px;
font-weight: 700;
letter-spacing: -0.18px;
color: var(–ghc-text);
}
.ghchart__rule {
height: 1.5px;
border-radius: 1.5px;
background: var(–ghc-divider);
margin: 10px 0 18px;
}
/* —————————————————————— */
/* Bar chart: subtitle, panels, bars, caption */
/* —————————————————————— */
.ghchart__subtitle {
margin: -6px 0 20px;
font-size: clamp(13px, 1.6vw, 15px);
line-height: 1.5;
color: var(–ghc-muted);
}
.ghchart__panel { margin-top: 30px; }
.ghchart__panel:first-of-type { margin-top: 6px; }
.ghchart__panel-title {
margin: 0 0 6px;
font-size: clamp(15px, 1.9vw, 18px);
font-weight: 700;
letter-spacing: -0.01em;
color: var(–ghc-text);
}
.ghchart__plot–bar { touch-action: pan-y; }
.ghchart__axisline {
stroke: var(–ghc-axis);
stroke-width: 1.25;
opacity: 0.35;
}
.ghchart__bar { transition: opacity 0.12s ease; }
.ghchart__barhit { fill: transparent; }
/* Always-on value labels above selected bars. */
.ghchart__barvalue {
fill: var(–ghc-text);
font-size: 20px;
font-weight: 700;
font-variant-numeric: tabular-nums;
pointer-events: none;
}
/* Anchor annotation: dotted reference line + floating pill. */
.ghchart__anno-line {
stroke: #8b949e;
stroke-width: 1.5;
stroke-dasharray: 4 3;
stroke-linecap: round;
pointer-events: none;
}
.ghchart__anno-chip {
fill: #ffebe9;
stroke: #ffcecb;
stroke-width: 1;
pointer-events: none;
}
.ghchart__anno-chip-text {
fill: #a0111f;
font-weight: 700;
pointer-events: none;
}
.ghchart__caption {
margin-top: 22px;
padding-top: 12px;
border-top: 1px solid var(–ghc-card-border);
font-size: 12.5px;
line-height: 1.55;
color: var(–ghc-muted);
}
.ghchart__caption b { color: var(–ghc-text); font-weight: 700; }
.ghchart__caption code {
font-family: ui-monospace, SFMono-Regular, “SF Mono”, Menlo, Consolas, monospace;
font-size: 0.92em;
padding: 1px 5px;
background: #f6f8fa;
border: 1px solid var(–ghc-card-border);
border-radius: 5px;
}
.ghchart__tag {
display: inline-block;
font-size: 10px;
font-weight: 650;
letter-spacing: 0.03em;
text-transform: uppercase;
padding: 2px 7px;
border-radius: 999px;
border: 1px solid #aceebb;
color: #0a5223;
background: #dafbe1;
white-space: nowrap;
vertical-align: middle;
}
/* —————————————————————— */
/* Distribution dashboard (segmented mix bar + ranked bar panels) */
/* —————————————————————— */
.ghchart__dist-section { margin-top: 28px; }
.ghchart__dist-section:first-of-type { margin-top: 12px; }
/* Segmented proportional “mix” bar: name inside, count/percent below.
Separators are 2px inside borders (box-sizing:border-box) rather than a
flex gap, so the three segments sum to exactly 100% with no overflow. */
.ghchart__seg {
display: flex;
width: 100%;
height: 42px;
margin-top: 2px;
border-radius: 7px;
overflow: hidden;
}
.ghchart__seg-cell {
display: flex;
align-items: center;
justify-content: center;
min-width: 0;
color: #ffffff;
font-size: 15px;
font-weight: 700;
letter-spacing: -0.01em;
white-space: nowrap;
overflow: hidden;
}
.ghchart__seg-cell + .ghchart__seg-cell { border-left: 2px solid var(–ghc-card-bg); }
.ghchart__seg-note-row {
display: flex;
width: 100%;
margin-top: 8px;
}
.ghchart__seg-note {
min-width: 0;
text-align: center;
font-size: 12.5px;
color: var(–ghc-muted);
font-variant-numeric: tabular-nums;
white-space: nowrap;
}
/* Keep the outer notes from spilling past the chart edges. */
.ghchart__seg-note:first-child { text-align: left; }
.ghchart__seg-note:last-child { text-align: right; }
.ghchart__seg-note b { color: var(–ghc-text); font-weight: 700; }
/* Ranked horizontal bar list: [category | bar track | value].
The list is the grid and rows use display:contents, so the category,
bar, and value columns line up across every row in a panel. */
.ghchart__dist-list {
display: grid;
grid-template-columns: max-content 1fr max-content;
align-items: center;
column-gap: 12px;
row-gap: 10px;
margin-top: 4px;
}
.ghchart__dist-row { display: contents; }
.ghchart__dist-cat {
text-align: right;
font-size: 13px;
line-height: 1.25;
color: var(–ghc-text);
white-space: nowrap;
}
.ghchart__dist-track { width: 100%; }
.ghchart__dist-bar {
height: 15px;
min-width: 2px;
border-radius: 3px;
}
.ghchart__dist-val {
font-size: 12.5px;
color: var(–ghc-muted);
font-variant-numeric: tabular-nums;
white-space: nowrap;
}
.ghchart__dist-val b { color: var(–ghc-text); font-weight: 700; }
/* Two-up panel grid (collapses to one column on narrow screens).
minmax(0,1fr) lets columns shrink so long labels never force overflow. */
.ghchart__dist-cols {
margin-top: 26px;
display: grid;
grid-template-columns: repeat(2, minmax(0, 1fr));
gap: 24px 30px;
}
.ghchart__dist-cols .ghchart__dist-section { margin-top: 0; }
.ghchart__dist-cols–stack { grid-template-columns: 1fr; }
.ghchart__dist-cols–stack .ghchart__dist-section { margin-top: 28px; }
.ghchart__dist-cols–stack .ghchart__dist-section:first-child { margin-top: 0; }
/* Tighten the label/value type a touch in the 2-up layout so the bars
keep room at the 699px blog width. */
.ghchart__dist-cols:not(.ghchart__dist-cols–stack) .ghchart__dist-cat { font-size: 12px; }
.ghchart__dist-cols:not(.ghchart__dist-cols–stack) .ghchart__dist-val { font-size: 11.5px; }
.ghchart__dist-cols:not(.ghchart__dist-cols–stack) .ghchart__dist-list { column-gap: 9px; }
@media (max-width: 600px) {
.ghchart__dist-cols { grid-template-columns: 1fr; gap: 26px; }
.ghchart__dist-cols .ghchart__dist-section ~ .ghchart__dist-section { margin-top: 2px; }
}
/* Let long category labels wrap on very narrow (mobile) widths. */
@media (max-width: 480px) {
.ghchart__dist-cat { white-space: normal; }
}
/* —————————————————————— */
/* Calendar heatmap (GitHub contribution-graph style) */
/* —————————————————————— */
.ghheat__eyebrow { display: flex; align-items: center; gap: 8px; margin: 0 0 12px; }
.ghheat__eyedot {
width: 9px; height: 9px; border-radius: 50%;
background: #cf222e; box-shadow: 0 0 0 3px rgba(207, 34, 46, 0.14);
flex: 0 0 auto;
}
.ghheat__eyetext {
font-size: 12px; font-weight: 700; letter-spacing: 0.08em;
text-transform: uppercase; color: #cf222e;
}
/* Subtitle here is a prominent lede, not the muted variant. */
.ghheat__subtitle {
color: var(–ghc-text);
font-size: clamp(14px, 1.7vw, 16px);
/* 24px top gap matches the github.blog H2 → paragraph block spacing. */
margin: 24px 0 8px;
}
.ghheat__subtitle b { font-weight: 700; }
.ghheat__panel { margin-top: 36px; }
.ghheat__phead {
display: flex; align-items: baseline; gap: 9px; flex-wrap: wrap;
margin-bottom: 16px;
}
.ghheat__badge {
display: inline-flex; align-items: center; justify-content: center;
width: 22px; height: 22px; border-radius: 50%;
color: #fff; font-size: 12px; font-weight: 700;
flex: 0 0 auto; align-self: center;
}
.ghheat__ptitle {
font-size: clamp(16px, 2vw, 19px); font-weight: 700;
letter-spacing: -0.01em; color: var(–ghc-text);
}
.ghheat__pdesc { font-size: 14px; color: var(–ghc-muted); }
.ghheat__body { display: flex; gap: 30px; align-items: flex-start; flex-wrap: wrap; }
.ghheat__gridwrap { flex: 1 1 340px; min-width: 260px; }
.ghheat__grid { display: block; width: 100%; height: auto; overflow: visible; }
.ghheat__cell {
stroke: rgba(27, 31, 36, 0.06);
stroke-width: 1;
transition: stroke 0.1s ease;
}
.ghheat__cell:hover { stroke: #24292f; stroke-width: 1.4; }
.ghheat__cell–pad { opacity: 0; pointer-events: none; }
.ghheat__wd, .ghheat__month {
fill: var(–ghc-muted); font-size: 11px; font-weight: 600;
}
.ghheat__side { flex: 1 1 250px; min-width: 230px; }
.ghheat__stat { display: flex; align-items: baseline; gap: 7px; }
.ghheat__statbig {
font-size: clamp(26px, 4vw, 34px); font-weight: 800; letter-spacing: -0.02em;
line-height: 1;
}
.ghheat__statsmall { font-size: 15px; font-weight: 600; color: var(–ghc-muted); }
.ghheat__note {
margin: 10px 0 16px; font-size: 14px; line-height: 1.55; color: var(–ghc-muted);
}
.ghheat__note b { color: var(–ghc-text); font-weight: 700; }
.ghheat__legend {
display: flex; align-items: center; gap: 5px;
font-size: 12.5px; color: var(–ghc-muted); flex-wrap: wrap;
}
.ghheat__sw { width: 12px; height: 12px; border-radius: 3px; display: inline-block; flex: 0 0 auto; }
.ghheat__sw–empty { border: 1px solid #d0d7de; }
.ghheat__legunit { margin-left: 2px; }
.ghheat__extra {
display: flex; align-items: flex-start; gap: 7px; margin-top: 14px;
font-size: 12px; line-height: 1.5; color: var(–ghc-muted); max-width: 330px;
}
.ghheat__extra .ghheat__sw { margin-top: 2px; }
/* —————————————————————— */
/* Tooltip */
/* —————————————————————— */
.ghchart__tooltip {
position: absolute;
z-index: 5;
top: 0;
left: 0;
min-width: 128px;
max-width: 260px;
padding: 10px 12px;
background: var(–ghc-card-bg);
border: 1px solid var(–ghc-card-border);
border-radius: 12px;
/* Layered drop shadow from Primer Brand’s ActionMenu (.ActionMenu__menu) */
box-shadow:
0px 100px 80px rgba(0, 0, 0, 0.01),
0px 41px 33px rgba(0, 0, 0, 0.02),
0px 22px 17px rgba(0, 0, 0, 0.02),
0px 12px 10px rgba(0, 0, 0, 0.03),
0px 6px 5px rgba(0, 0, 0, 0.04),
0px 2px 2px rgba(0, 0, 0, 0.07);
pointer-events: none;
opacity: 0;
transform: translate(-50%, -100%);
/* Fade in on show and out on hide; quickly ease left/top when tracking
from one point to the next. The position ease is suppressed on the
first appearance (see chart.js) so the tooltip fades in place rather
than sliding in from its previous spot. */
transition: opacity 0.12s ease,
left 0.1s cubic-bezier(0.4, 0, 0.2, 1),
top 0.1s cubic-bezier(0.4, 0, 0.2, 1);
will-change: opacity, transform, left, top;
}
.ghchart__tooltip[data-visible=”true”] { opacity: 1; }
.ghchart__tt-title {
font-size: 13px;
font-weight: 700;
color: var(–ghc-text);
margin-bottom: 6px;
}
.ghchart__tt-row {
display: flex;
align-items: center;
gap: 8px;
font-size: 13px;
line-height: 1.6;
color: var(–ghc-muted);
}
.ghchart__tt-swatch { width: 10px; height: 10px; border-radius: 3px; flex: 0 0 auto; }
.ghchart__tt-name { flex: 1 1 auto; }
.ghchart__tt-value { font-weight: 700; color: var(–ghc-text); font-variant-numeric: tabular-nums; }
/* Bar tooltip body: a title line + free-form text lines (no swatches). */
.ghchart__tt-line {
font-size: 13px;
line-height: 1.5;
color: var(–ghc-muted);
}
.ghchart__tt-line:first-child { color: var(–ghc-text); font-weight: 600; }
.ghchart__tt-line + .ghchart__tt-line { margin-top: 2px; }
@media (prefers-reduced-motion: reduce) {
.ghchart__dot,
.ghchart__guide,
.ghchart__bar,
.ghchart__pt,
.ghchart__square,
.ghheat__cell,
.ghchart__tooltip { transition: none; }
}
/*
Shared chart engine — reusable renderer for the blog-charts library.
——————————————————————
Exposes window.GHChartEngine = { renderers, render(config, mountEl?) }.
Renderers are keyed by config.type (currently “line”); add a new viz type
by registering GHChartEngine.renderers[] = function (root, config) {…}.
This same file is embedded verbatim at the top of each exported WordPress
chart.js, followed by that chart’s CONFIG + a small auto-boot. It has no
external dependencies and is safe to include more than once on a page.
*/
(function (global) {
“use strict”;
var SVGNS = “http://www.w3.org/2000/svg”;
function el(tag, attrs) {
var node = document.createElementNS(SVGNS, tag);
if (attrs) {
for (var k in attrs) {
if (Object.prototype.hasOwnProperty.call(attrs, k)) {
node.setAttribute(k, attrs[k]);
}
}
}
return node;
}
function html(tag, cls) {
var node = document.createElement(tag);
if (cls) node.className = cls;
return node;
}
function clamp(v, lo, hi) { return v hi ? hi : v; }
var renderers = {};
/* ================================================================
Line chart renderer
================================================================ */
renderers.line = function (root, config) {
// viewBox geometry (design units; scales fluidly to any width).
var VB = { w: 1000, h: 560 };
var M = { top: 30, right: 34, bottom: 56, left: 86 };
// Inset the plotted points slightly from the axis so the first/last
// months (e.g. “Jan”) don’t crowd the y-axis labels (e.g. “50”).
var PAD_X = 18;
var innerW = VB.w – M.left – M.right;
var innerH = VB.h – M.top – M.bottom;
// Reset (in case of re-render) and use a unique id prefix so multiple
// charts on one page never share gradient ids.
root.textContent = “”;
var uid = config.mountId;
var n = config.labels.length;
var yMin = config.yAxis.min;
var yMax = config.yAxis.max;
var step = config.yAxis.step;
// Y-axis tick labels can format differently from the tooltip values
// (e.g. a plain “40” on the axis but “40%” in the tooltip).
var fmtAxis = config.formatAxis || config.formatValue;
var plotW = innerW – 2 * PAD_X;
var stepX = n <= 1 ? 0 : plotW / (n – 1);
function xAt(i) { return n <= 1 ? M.left + innerW / 2 : M.left + PAD_X + stepX * i; }
function yAt(v) { return M.top + innerH * (1 – (v – yMin) / (yMax – yMin)); }
var baseY = yAt(yMin);
/* —- Title + divider (top) ———————————- */
var title = html("span", "ghchart__title");
title.textContent = config.title;
root.appendChild(title);
root.appendChild(html("div", "ghchart__rule"));
/* —- Header + legend —————————————- */
if (!config.hideLegend) {
var header = html("div", "ghchart__header");
var legend = html("div", "ghchart__legend");
config.series.forEach(function (s) {
var item = html("span", "ghchart__legend-item");
var sw = html("span", "ghchart__swatch");
sw.style.background = s.color;
item.appendChild(sw);
item.appendChild(document.createTextNode(s.name));
legend.appendChild(item);
});
header.appendChild(legend);
root.appendChild(header);
}
/* —- SVG plot ———————————————– */
var svg = el("svg", {
"class": "ghchart__plot",
viewBox: "0 0 " + VB.w + " " + VB.h,
preserveAspectRatio: "xMidYMid meet",
role: "img",
"aria-label": config.title + " line chart"
});
// Gradient defs (one per area series).
var defs = el("defs");
config.series.forEach(function (s, si) {
if (!s.area) return;
var g = el("linearGradient", {
id: uid + "-grad-" + si, x1: "0", y1: "0", x2: "0", y2: "1"
});
g.appendChild(el("stop", { offset: "0", "stop-color": s.color, "stop-opacity": "0.28" }));
g.appendChild(el("stop", { offset: "0.55", "stop-color": s.color, "stop-opacity": "0.08" }));
g.appendChild(el("stop", { offset: "1", "stop-color": s.color, "stop-opacity": "0" }));
defs.appendChild(g);
});
// Diagonal-hatch pattern for an optional "partial / projected" band.
if (config.projection) {
var pat = el("pattern", {
id: uid + "-hatch", width: 7, height: 7,
patternUnits: "userSpaceOnUse", patternTransform: "rotate(45)"
});
pat.appendChild(el("line", {
x1: 0, y1: 0, x2: 0, y2: 7,
stroke: config.projection.color || "#8c959f",
"stroke-width": 1.1, "stroke-opacity": 0.5
}));
defs.appendChild(pat);
}
svg.appendChild(defs);
// Gridlines + y-axis labels.
for (var v = yMin; v cubic Bezier) path builder.
function smooth(points) {
if (!points.length) return “”;
if (points.length < 2) return "M" + points[0].x + "," + points[0].y;
var d = "M " + points[0].x + "," + points[0].y;
for (var i = 0; i < points.length – 1; i++) {
var p0 = points[i – 1] || points[i];
var p1 = points[i];
var p2 = points[i + 1];
var p3 = points[i + 2] || p2;
var t = 1 / 6;
var c1x = p1.x + (p2.x – p0.x) * t;
var c1y = p1.y + (p2.y – p0.y) * t;
var c2x = p2.x – (p3.x – p1.x) * t;
var c2y = p2.y – (p3.y – p1.y) * t;
d += " C " + c1x + "," + c1y + " " + c2x + "," + c2y + " " + p2.x + "," + p2.y;
}
return d;
}
// Area fills (drawn first, behind lines).
config.series.forEach(function (s, si) {
if (!s.area) return;
var p = pts[si];
var d = smooth(p) + " L " + p[p.length – 1].x + "," + baseY +
" L " + p[0].x + "," + baseY + " Z";
svg.appendChild(el("path", { d: d, fill: "url(#" + uid + "-grad-" + si + ")" }));
});
// Vertical hover guide (hidden until hover).
var guide = el("line", {
"class": "ghchart__guide",
x1: xAt(0), y1: M.top – 6, x2: xAt(0), y2: baseY
});
svg.appendChild(guide);
// Lines (draw in reverse so the first series sits on top).
config.series.slice().reverse().forEach(function (s) {
var si = config.series.indexOf(s);
svg.appendChild(el("path", {
"class": "ghchart__line",
d: smooth(pts[si]),
stroke: s.color,
"stroke-width": s.width || (si === 0 ? 4 : 3.25)
}));
});
// Dots (keep references for hover emphasis). When config.hideDots is set
// (dense daily lines), dots rest invisible and only the hovered one shows.
var dotEls = config.series.map(function (s, si) {
return pts[si].map(function (pt) {
var c = el("circle", {
"class": "ghchart__dot",
cx: pt.x, cy: pt.y,
r: config.hideDots ? 0 : (si === 0 ? 4.5 : 4),
fill: s.color
});
svg.appendChild(c);
return c;
});
});
// Transparent hit area for pointer capture.
var hit = el("rect", {
"class": "ghchart__hit",
x: M.left,
y: M.top – 6,
width: innerW,
height: baseY – M.top + 12
});
svg.appendChild(hit);
root.appendChild(svg);
/* —- Tooltip ———————————————— */
var tip = html("div", "ghchart__tooltip");
tip.setAttribute("role", "status");
var tipTitle = html("div", "ghchart__tt-title");
tip.appendChild(tipTitle);
var tipRows = config.series.map(function (s) {
var row = html("div", "ghchart__tt-row");
var sw = html("span", "ghchart__tt-swatch");
sw.style.background = s.color;
var name = html("span", "ghchart__tt-name");
name.textContent = s.name;
var val = html("span", "ghchart__tt-value");
row.appendChild(sw);
row.appendChild(name);
row.appendChild(val);
tip.appendChild(row);
return val;
});
root.appendChild(tip);
/* —- Hover / focus interactivity —————————- */
var activeIndex = -1;
var baseR = config.series.map(function (s, si) {
return config.hideDots ? 0 : (si === 0 ? 4.5 : 4);
});
// Radius of the single emphasized dot under the pointer.
var dotActiveR = config.series.map(function (s, si) {
return config.hideDots ? 6 : baseR[si] + 2.5;
});
var motionMQ = window.matchMedia
? window.matchMedia("(prefers-reduced-motion: reduce)")
: null;
function reduceMotion() { return !!(motionMQ && motionMQ.matches); }
function indexFromClientX(clientX) {
var rect = svg.getBoundingClientRect();
var relX = (clientX – rect.left) / rect.width * VB.w;
var i = stepX ? Math.round((relX – (M.left + PAD_X)) / stepX) : 0;
return clamp(i, 0, n – 1);
}
function show(i) {
if (i === activeIndex) return;
var reappearing = activeIndex === -1;
activeIndex = i;
guide.setAttribute("x1", xAt(i));
guide.setAttribute("x2", xAt(i));
guide.style.opacity = "1";
// Emphasize the hovered column's dots; reset the rest.
dotEls.forEach(function (col, si) {
col.forEach(function (c, ci) {
c.setAttribute("r", ci === i ? dotActiveR[si] : baseR[si]);
});
});
// Fill tooltip.
tipTitle.textContent = config.labels[i];
config.series.forEach(function (s, si) {
tipRows[si].textContent = config.formatValue(s.values[i]);
});
// Anchor above the highest point in this column.
var topSi = 0, topY = Infinity;
config.series.forEach(function (s, si) {
var yy = yAt(s.values[i]);
if (yy < topY) { topY = yy; topSi = si; }
});
var anchor = dotEls[topSi][i].getBoundingClientRect();
var rootRect = root.getBoundingClientRect();
var left = anchor.left + anchor.width / 2 – rootRect.left;
var top = anchor.top – rootRect.top – 12;
// On the first appearance, fade in exactly at the point: suppress the
// position ease so it doesn't slide in from its previous resting spot.
var suppress = reappearing && !reduceMotion();
if (suppress) tip.style.transition = "opacity 0.12s ease";
tip.setAttribute("data-visible", "true");
// Clamp horizontally within the container.
var halfW = tip.offsetWidth / 2;
left = clamp(left, halfW + 2, root.clientWidth – halfW – 2);
// Flip below the point if there's no room above.
if (top – tip.offsetHeight < 0) {
top = anchor.bottom – rootRect.top + 12;
tip.style.transform = "translate(-50%, 0)";
} else {
tip.style.transform = "translate(-50%, -100%)";
}
tip.style.left = left + "px";
tip.style.top = top + "px";
// Commit that position without animating, then restore the CSS
// transition so subsequent point-to-point moves ease into place.
if (suppress) {
void tip.offsetWidth;
tip.style.transition = "";
}
}
function hide() {
activeIndex = -1;
guide.style.opacity = "0";
tip.setAttribute("data-visible", "false");
dotEls.forEach(function (col, si) {
col.forEach(function (c) { c.setAttribute("r", baseR[si]); });
});
}
hit.addEventListener("pointermove", function (e) { show(indexFromClientX(e.clientX)); });
hit.addEventListener("pointerdown", function (e) { show(indexFromClientX(e.clientX)); });
hit.addEventListener("pointerleave", hide);
// Keyboard access.
svg.setAttribute("tabindex", "0");
svg.addEventListener("keydown", function (e) {
if (e.key === "ArrowRight" || e.key === "ArrowLeft") {
var start = activeIndex { title, lines:[…] } }
No printed value labels — values surface on hover (consistent with
the line chart). Bars use a single tunable color with rounded tops.
================================================================ */
renderers.bar = function (root, config) {
root.textContent = “”;
var barColor = (config.series && config.series[0] && config.series[0].color) || “#ff7b72”;
var barRadius = config.barRadius != null ? config.barRadius : 8;
// Per-bar fill: a bar may point at a different series (e.g. a muted
// “preliminary” color) via panel.barSeries[index]; otherwise series[0].
function barColorFor(panel, j) {
var si = (panel.barSeries && panel.barSeries[j] != null) ? panel.barSeries[j] : 0;
var s = config.series && config.series[si];
return (s && s.color) || barColor;
}
var motionMQ = window.matchMedia
? window.matchMedia(“(prefers-reduced-motion: reduce)”)
: null;
function reduceMotion() { return !!(motionMQ && motionMQ.matches); }
/* —- Title + divider (+ optional subtitle) —————— */
var title = html(“span”, “ghchart__title”);
title.textContent = config.title;
root.appendChild(title);
root.appendChild(html(“div”, “ghchart__rule”));
if (config.subtitle) {
var sub = html(“p”, “ghchart__subtitle”);
sub.textContent = config.subtitle;
root.appendChild(sub);
}
/* —- One shared tooltip for all panels ———————- */
var tip = html(“div”, “ghchart__tooltip”);
tip.setAttribute(“role”, “status”);
var tipTitle = html(“div”, “ghchart__tt-title”);
var tipBody = html(“div”, “ghchart__tt-body”);
tip.appendChild(tipTitle);
tip.appendChild(tipBody);
root.appendChild(tip);
var allBars = []; // { el, pi, bi }
var activeKey = null; // “pi:bi” of the hovered bar
function hideTip() {
activeKey = null;
tip.setAttribute(“data-visible”, “false”);
allBars.forEach(function (b) { b.el.style.opacity = “1”; });
}
// Hoisted: referenced by the per-column pointer handlers below.
function showTip(pi, bi, panel, panelBars) {
var reappearing = activeKey === null;
activeKey = pi + “:” + bi;
allBars.forEach(function (b) {
b.el.style.opacity = (b.pi === pi && b.bi === bi) ? “1” : “0.42”;
});
var content = panel.tooltip
? panel.tooltip(bi, panel)
: { title: (panel.labels || [])[bi],
lines: [ (panel.formatValue || String)(panel.values[bi]) ] };
tipTitle.textContent = content.title != null ? content.title : “”;
tipBody.textContent = “”;
(content.lines || []).forEach(function (ln) {
var row = html(“div”, “ghchart__tt-line”);
row.textContent = ln;
tipBody.appendChild(row);
});
var anchor = panelBars[bi].el.getBoundingClientRect();
var rootRect = root.getBoundingClientRect();
var left = anchor.left + anchor.width / 2 – rootRect.left;
var top = anchor.top – rootRect.top – 12;
var suppress = reappearing && !reduceMotion();
if (suppress) tip.style.transition = “opacity 0.12s ease”;
tip.setAttribute(“data-visible”, “true”);
var halfW = tip.offsetWidth / 2;
left = clamp(left, halfW + 2, root.clientWidth – halfW – 2);
if (top – tip.offsetHeight 0) {
for (var v = yMin; v <= yMax + 1e-9; v += step) {
var gy = yAt(v);
svg.appendChild(el("line", {
"class": "ghchart__gridline", x1: M.left, y1: gy, x2: VB.w – M.right, y2: gy
}));
var yl = el("text", {
"class": "ghchart__axislabel ghchart__axislabel–y",
x: M.left – 18, y: gy, dy: "0.32em", "text-anchor": "end"
});
yl.textContent = fmt(v);
svg.appendChild(yl);
}
}
// Solid baseline.
svg.appendChild(el("line", {
"class": "ghchart__axisline", x1: M.left, y1: baseY, x2: VB.w – M.right, y2: baseY
}));
// x-axis labels.
for (var i = 0; i < nb; i++) {
var xl = el("text", {
"class": "ghchart__axislabel ghchart__axislabel–x",
x: xCenter(i), y: VB.h – M.bottom + 30, "text-anchor": "middle"
});
if (panel.xLabelSize) xl.setAttribute("style", "font-size:" + panel.xLabelSize + "px");
xl.textContent = labels[i];
svg.appendChild(xl);
}
// Bars (rounded top corners only) + full-height hover columns.
var panelBars = [];
for (var j = 0; j dark ramp is derived from a single tunable base color.
================================================================ */
renderers.heatmap = function (root, config) {
root.textContent = “”;
var WHITE = [255, 255, 255], BLACK = [0, 0, 0];
function hexToRgb(h) {
h = String(h).replace(“#”, “”);
if (h.length === 3) h = h[0] + h[0] + h[1] + h[1] + h[2] + h[2];
return [parseInt(h.slice(0, 2), 16), parseInt(h.slice(2, 4), 16), parseInt(h.slice(4, 6), 16)];
}
function rgbToHex(c) {
return “#” + c.map(function (x) {
x = Math.max(0, Math.min(255, Math.round(x)));
return (x level 4 dark) from one hex.
function rampFrom(baseHex) {
var b = hexToRgb(baseHex);
return [
rgbToHex(mix(b, WHITE, 0.80)),
rgbToHex(mix(b, WHITE, 0.52)),
rgbToHex(mix(b, WHITE, 0.20)),
baseHex,
rgbToHex(mix(b, BLACK, 0.30))
];
}
function trim0(s) { return s.replace(/.0$/, “”); }
function fmtM(v) {
if (v >= 1000) { var g = v / 1000; return (g >= 10 ? Math.round(g) : trim0(g.toFixed(1))) + “B”; }
if (v >= 1) return trim0(v.toFixed(1)) + “M”;
return Math.round(v * 1000) + “K”;
}
var MON = [“Jan”, “Feb”, “Mar”, “Apr”, “May”, “Jun”, “Jul”, “Aug”, “Sep”, “Oct”, “Nov”, “Dec”];
var MON_FULL = [“January”, “February”, “March”, “April”, “May”, “June”,
“July”, “August”, “September”, “October”, “November”, “December”];
var WD = [“Sun”, “Mon”, “Tue”, “Wed”, “Thu”, “Fri”, “Sat”];
var year = config.year || 2026;
var startM = config.startMonth != null ? config.startMonth : 0;
var endM = config.endMonth != null ? config.endMonth : 5;
var emptyColor = config.emptyColor || “#ebedf0”;
function daysInMonth(y, m) { return new Date(y, m + 1, 0).getDate(); }
function parseISO(s) { var p = s.split(“-“); return new Date(+p[0], +p[1] – 1, +p[2]); }
function dayStart(dt) { return new Date(dt.getFullYear(), dt.getMonth(), dt.getDate()); }
/* —- Eyebrow + title + subtitle —————————– */
if (config.eyebrow) {
var eb = html(“div”, “ghheat__eyebrow”);
eb.appendChild(html(“span”, “ghheat__eyedot”));
var ebt = html(“span”, “ghheat__eyetext”);
ebt.textContent = config.eyebrow;
eb.appendChild(ebt);
root.appendChild(eb);
}
var title = html(“span”, “ghchart__title”);
title.textContent = config.title;
root.appendChild(title);
if (config.subtitle) {
var sub = html(“p”, “ghchart__subtitle ghheat__subtitle”);
sub.innerHTML = config.subtitle;
root.appendChild(sub);
}
/* —- One shared tooltip ————————————– */
var tip = html(“div”, “ghchart__tooltip”);
tip.setAttribute(“role”, “status”);
var tipTitle = html(“div”, “ghchart__tt-title”);
var tipBody = html(“div”, “ghchart__tt-body”);
tip.appendChild(tipTitle);
tip.appendChild(tipBody);
root.appendChild(tip);
var motionMQ = window.matchMedia ? window.matchMedia(“(prefers-reduced-motion: reduce)”) : null;
function reduceMotion() { return !!(motionMQ && motionMQ.matches); }
var activeCell = null;
function hideTip() { activeCell = null; tip.setAttribute(“data-visible”, “false”); }
function showTip(rectEl, titleText, lines) {
var reappearing = activeCell === null;
activeCell = rectEl;
tipTitle.textContent = titleText;
tipBody.textContent = “”;
lines.forEach(function (ln) {
var r = html(“div”, “ghchart__tt-line”);
r.innerHTML = ln;
tipBody.appendChild(r);
});
var a = rectEl.getBoundingClientRect(), rr = root.getBoundingClientRect();
var left = a.left + a.width / 2 – rr.left, top = a.top – rr.top – 12;
var suppress = reappearing && !reduceMotion();
if (suppress) tip.style.transition = “opacity 0.12s ease”;
tip.setAttribute(“data-visible”, “true”);
var halfW = tip.offsetWidth / 2;
left = clamp(left, halfW + 2, root.clientWidth – halfW – 2);
if (top – tip.offsetHeight < 0) {
top = a.bottom – rr.top + 12;
tip.style.transform = "translate(-50%, 0)";
} else {
tip.style.transform = "translate(-50%, -100%)";
}
tip.style.left = left + "px";
tip.style.top = top + "px";
if (suppress) { void tip.offsetWidth; tip.style.transition = ""; }
}
/* —- Panels ————————————————– */
(config.panels || []).forEach(function (panel, pi) {
var base = (config.series && config.series[pi] && config.series[pi].color) || panel.base || "#3094ff";
var ramp = rampFrom(base);
var strong = ramp[4];
var totals = panel.months || [];
var activeVals = [];
for (var mi = startM; mi <= endM; mi++) { if (totals[mi] != null) activeVals.push(totals[mi]); }
var vmin = activeVals.length ? Math.min.apply(null, activeVals) : 0;
var vmax = activeVals.length ? Math.max.apply(null, activeVals) : 1;
function levelFor(t) {
if (t == null) return -1;
if (vmax === vmin) return 4;
return Math.round((t – vmin) / (vmax – vmin) * 4);
}
var af = panel.activeFrom ? parseISO(panel.activeFrom) : new Date(year, startM, 1);
var at = panel.activeTo ? parseISO(panel.activeTo) : new Date(year, endM, daysInMonth(year, endM));
var wrap = html("div", "ghheat__panel");
var head = html("div", "ghheat__phead");
var badge = html("span", "ghheat__badge");
badge.textContent = panel.badge != null ? panel.badge : (pi + 1);
badge.style.background = strong;
head.appendChild(badge);
var pt = html("span", "ghheat__ptitle");
pt.textContent = panel.title;
head.appendChild(pt);
if (panel.descriptor) {
var pd = html("span", "ghheat__pdesc");
pd.textContent = panel.descriptor;
head.appendChild(pd);
}
wrap.appendChild(head);
var body = html("div", "ghheat__body");
/* —- Calendar grid (SVG) —- */
var gridStart = new Date(year, startM, 1);
var gs = new Date(gridStart);
gs.setDate(gs.getDate() – gs.getDay()); // back to Sunday
var gridEnd = new Date(year, endM, daysInMonth(year, endM));
var ge = new Date(gridEnd);
ge.setDate(ge.getDate() + (6 – ge.getDay())); // forward to Saturday
var nCols = Math.round((ge – gs) / (7 * 86400000)) + 1;
var cell = 13, sq = 11, rad = 2.5, labL = 34, labT = 18;
var W = labL + nCols * cell, H = labT + 7 * cell;
var svg = el("svg", {
"class": "ghheat__grid",
viewBox: "0 0 " + W + " " + H,
preserveAspectRatio: "xMinYMin meet",
role: "img",
"aria-label": panel.title + " calendar heatmap"
});
[1, 3, 5].forEach(function (r) {
var t = el("text", {
"class": "ghheat__wd", x: labL – 6, y: labT + r * cell + sq / 2,
dy: "0.32em", "text-anchor": "end"
});
t.textContent = WD[r];
svg.appendChild(t);
});
// Month labels above the column where each month begins.
for (var lm = startM; lm <= endM; lm++) {
var first = new Date(year, lm, 1);
var colOf = Math.floor((dayStart(first) – gs) / (7 * 86400000));
var mlab = el("text", { "class": "ghheat__month", x: labL + colOf * cell, y: 12, "text-anchor": "start" });
mlab.textContent = MON[lm];
svg.appendChild(mlab);
}
var afS = dayStart(af), atS = dayStart(at);
var d = new Date(gs);
for (var i = 0; i = startM && m = afS && ds = 0 ? ramp[lvl] : emptyColor
});
if (inRange) {
(function (dt, mm, has) {
var dateStr = WD[dt.getDay()] + ” u00b7 ” + MON[mm] + ” ” + dt.getDate() + “, ” + year;
var lines;
if (has) {
var daily = totals[mm] / daysInMonth(year, mm);
lines = [
“” + fmtM(daily) + “ ” + panel.legendLabel,
MON_FULL[mm] + ” u00b7 ” + fmtM(totals[mm]) + ” ” + panel.unitTotal
];
} else {
lines = [panel.emptyNote || “No vetted data”];
}
cellEl.addEventListener(“pointermove”, function () { showTip(cellEl, dateStr, lines); });
cellEl.addEventListener(“pointerdown”, function () { showTip(cellEl, dateStr, lines); });
cellEl.addEventListener(“pointerleave”, hideTip);
})(new Date(d), m, hasData);
} else {
cellEl.setAttribute(“class”, “ghheat__cell ghheat__cell–pad”);
}
svg.appendChild(cellEl);
d.setDate(d.getDate() + 1);
}
var gridwrap = html(“div”, “ghheat__gridwrap”);
gridwrap.appendChild(svg);
body.appendChild(gridwrap);
/* —- Side column: stat + note + legend + extra —- */
var side = html(“div”, “ghheat__side”);
if (panel.stat) {
var stat = html(“div”, “ghheat__stat”);
var big = html(“span”, “ghheat__statbig”);
big.textContent = panel.stat.big;
big.style.color = strong;
stat.appendChild(big);
if (panel.stat.small) {
var small = html(“span”, “ghheat__statsmall”);
small.textContent = panel.stat.small;
stat.appendChild(small);
}
side.appendChild(stat);
}
if (panel.note) {
var note = html(“p”, “ghheat__note”);
note.innerHTML = panel.note;
side.appendChild(note);
}
var leg = html(“div”, “ghheat__legend”);
var lw1 = html(“span”, “ghheat__legword”); lw1.textContent = “Fewer”; leg.appendChild(lw1);
ramp.forEach(function (c) {
var s = html(“span”, “ghheat__sw”); s.style.background = c; leg.appendChild(s);
});
var lw2 = html(“span”, “ghheat__legword”); lw2.textContent = “More”; leg.appendChild(lw2);
if (panel.legendLabel) {
var lu = html(“span”, “ghheat__legunit”); lu.textContent = “u00b7 ” + panel.legendLabel; leg.appendChild(lu);
}
side.appendChild(leg);
if (panel.extraNote) {
var ex = html(“div”, “ghheat__extra”);
var exsw = html(“span”, “ghheat__sw ghheat__sw–empty”);
exsw.style.background = emptyColor;
ex.appendChild(exsw);
var ext = html(“span”, “ghheat__extratext”);
ext.innerHTML = panel.extraNote;
ex.appendChild(ext);
side.appendChild(ex);
}
body.appendChild(side);
wrap.appendChild(body);
root.appendChild(wrap);
});
if (config.caption) {
var cap = html(“div”, “ghchart__caption”);
cap.innerHTML = config.caption;
root.appendChild(cap);
}
};
/* ================================================================
Scatter renderer — X/Y numeric plot with categorical points.
Used for cost-vs-quality benchmark charts: a highlighted “primary”
point (glow halo), a “reference” point with a dotted crosshair, and
muted “other” points. Values never print on the marks — a point’s
name shows for identity and the exact (y, x) reveals on hover.
================================================================ */
renderers.scatter = function (root, config) {
root.textContent = “”;
var uid = config.mountId;
var VB = { w: 1000, h: 600 };
var M = { top: 40, right: 30, bottom: 74, left: 96 };
var innerW = VB.w – M.left – M.right;
var innerH = VB.h – M.top – M.bottom;
var xa = config.xAxis, ya = config.yAxis;
var fmtX = xa.format || function (v) { return String(v); };
var fmtY = ya.format || function (v) { return String(v); };
var tipSuffix = config.tipSuffix || “”;
function xAt(v) { return M.left + innerW * (v – xa.min) / (xa.max – xa.min); }
function yAt(v) { return M.top + innerH * (1 – (v – ya.min) / (ya.max – ya.min)); }
var baseY = yAt(ya.min);
var motionMQ = window.matchMedia
? window.matchMedia(“(prefers-reduced-motion: reduce)”)
: null;
function reduceMotion() { return !!(motionMQ && motionMQ.matches); }
function colorOf(pt) {
var s = config.series && config.series[pt.series || 0];
return (s && s.color) || “#8c959f”;
}
/* —- Title (compact narrative headline, no rule) ———— */
var title = html(“div”, “ghchart__headline”);
title.textContent = config.title;
root.appendChild(title);
/* —- Header + legend (from series) ————————– */
if (!config.hideLegend) {
var header = html(“div”, “ghchart__header”);
var legend = html(“div”, “ghchart__legend”);
(config.series || []).forEach(function (s) {
var item = html(“span”, “ghchart__legend-item”);
var sw = html(“span”, “ghchart__swatch ghchart__swatch–dot”);
sw.style.background = s.color;
item.appendChild(sw);
item.appendChild(document.createTextNode(s.name));
legend.appendChild(item);
});
header.appendChild(legend);
root.appendChild(header);
}
/* —- SVG plot ———————————————– */
var svg = el(“svg”, {
“class”: “ghchart__plot ghchart__plot–scatter”,
viewBox: “0 0 ” + VB.w + ” ” + VB.h,
preserveAspectRatio: “xMidYMid meet”,
role: “img”,
“aria-label”: config.title + ” scatter plot”
});
// Gridlines (both directions) + tick labels.
var eps = 1e-6;
for (var yv = ya.min; yv <= ya.max + eps; yv += ya.step) {
var gy = yAt(yv);
svg.appendChild(el("line", {
"class": "ghchart__gridline",
x1: M.left, y1: gy, x2: VB.w – M.right, y2: gy
}));
var yl = el("text", {
"class": "ghchart__axislabel ghchart__axislabel–y",
x: M.left – 16, y: gy, dy: "0.32em", "text-anchor": "end"
});
yl.textContent = fmtY(yv);
svg.appendChild(yl);
}
for (var xv = xa.min; xv <= xa.max + eps; xv += xa.step) {
var gx = xAt(xv);
svg.appendChild(el("line", {
"class": "ghchart__gridline ghchart__gridline–v",
x1: gx, y1: M.top, x2: gx, y2: baseY
}));
var isFirst = Math.abs(xv – xa.min) < eps;
var isLast = Math.abs(xv – xa.max) < eps;
var xl = el("text", {
"class": "ghchart__axislabel ghchart__axislabel–x",
x: gx, y: baseY + 34,
"text-anchor": isFirst ? "start" : (isLast ? "end" : "middle")
});
xl.textContent = fmtX(xv);
svg.appendChild(xl);
}
// Axis titles.
if (xa.title) {
var xt = el("text", {
"class": "ghchart__axistitle",
x: M.left + innerW / 2, y: VB.h – 12, "text-anchor": "middle"
});
xt.textContent = xa.title;
svg.appendChild(xt);
}
if (ya.title) {
var ytX = 24, ytY = M.top + innerH / 2;
var yt = el("text", {
"class": "ghchart__axistitle",
x: ytX, y: ytY, "text-anchor": "middle",
transform: "rotate(-90 " + ytX + " " + ytY + ")"
});
yt.textContent = ya.title;
svg.appendChild(yt);
}
// Reference crosshair through the flagged point (dual dotted lines).
var refPt = (config.points || []).filter(function (p) { return p.reference; })[0];
if (refPt) {
var rColor = colorOf(refPt);
var rx = xAt(refPt.x), ry = yAt(refPt.y);
svg.appendChild(el("line", {
"class": "ghchart__crosshair",
x1: rx, y1: M.top, x2: rx, y2: baseY, stroke: rColor
}));
svg.appendChild(el("line", {
"class": "ghchart__crosshair",
x1: M.left, y1: ry, x2: VB.w – M.right, y2: ry, stroke: rColor
}));
}
// Points: halo (highlight/reference) + dot + name label.
var dotEls = [], hitEls = [];
(config.points || []).forEach(function (pt, i) {
var cx = xAt(pt.x), cy = yAt(pt.y), c = colorOf(pt);
var big = pt.highlight || pt.reference;
if (big) {
svg.appendChild(el("circle", {
"class": "ghchart__halo", cx: cx, cy: cy, r: 17, fill: c
}));
}
var dot = el("circle", {
"class": "ghchart__pt", cx: cx, cy: cy,
r: big ? 9 : 5.5, fill: c
});
svg.appendChild(dot);
dotEls.push({ el: dot, baseR: big ? 9 : 5.5 });
// Name label — bold+colored for the story points, muted for the rest.
var pos = pt.labelPos || (pt.highlight ? "below" : pt.reference ? "above" : "right");
var dx = 0, dy = 0, anchor = "middle";
var gap = big ? 15 : 9;
if (pos === "right") { dx = gap + 4; dy = 5; anchor = "start"; }
else if (pos === "left") { dx = -(gap + 4); dy = 5; anchor = "end"; }
else if (pos === "above") { dy = -(gap + 6); anchor = "middle"; }
else { dy = gap + 16; anchor = "middle"; } // below
var lbl = el("text", {
"class": "ghchart__pt-label" + (big ? " ghchart__pt-label–strong" : ""),
x: cx + dx, y: cy + dy, "text-anchor": anchor,
fill: big ? c : null
});
lbl.textContent = pt.label;
svg.appendChild(lbl);
// Transparent hit target for hover/focus.
var hit = el("circle", {
"class": "ghchart__pthit", cx: cx, cy: cy, r: 20,
tabindex: "0", role: "img",
"aria-label": pt.label + ": " + fmtY(pt.y) + ", " + fmtX(pt.x) + tipSuffix
});
svg.appendChild(hit);
hitEls.push(hit);
});
root.appendChild(svg);
/* —- Tooltip (title + free lines) ————————— */
var tip = html("div", "ghchart__tooltip");
tip.setAttribute("role", "status");
var tipTitle = html("div", "ghchart__tt-title");
var tipBody = html("div", "ghchart__tt-body");
tip.appendChild(tipTitle);
tip.appendChild(tipBody);
root.appendChild(tip);
var activeIndex = -1;
function show(i) {
var pt = config.points[i];
if (!pt) return;
var reappearing = activeIndex === -1;
activeIndex = i;
dotEls.forEach(function (d, di) {
d.el.setAttribute("r", di === i ? d.baseR + 2.5 : d.baseR);
});
tipTitle.textContent = pt.label;
tipBody.textContent = "";
var line = html("div", "ghchart__tt-line");
line.textContent = fmtY(pt.y) + " · " + fmtX(pt.x) + tipSuffix;
tipBody.appendChild(line);
var anchor = dotEls[i].el.getBoundingClientRect();
var rootRect = root.getBoundingClientRect();
var left = anchor.left + anchor.width / 2 – rootRect.left;
var top = anchor.top – rootRect.top – 12;
var suppress = reappearing && !reduceMotion();
if (suppress) tip.style.transition = "opacity 0.12s ease";
tip.setAttribute("data-visible", "true");
var halfW = tip.offsetWidth / 2;
left = clamp(left, halfW + 2, root.clientWidth – halfW – 2);
if (top – tip.offsetHeight 0) {
svg.appendChild(el(“line”, {
“class”: “ghchart__phase-sep”, x1: x0, y1: M.top, x2: x0, y2: baseY
}));
}
var pl = el(“text”, {
“class”: “ghchart__phase-label”, x: (x0 + x1) / 2, y: M.top – 40,
“text-anchor”: “middle”
});
pl.textContent = ph.label;
svg.appendChild(pl);
if (ph.avg) {
var pa = el(“text”, {
“class”: “ghchart__phase-avg”, x: (x0 + x1) / 2, y: M.top + 24,
“text-anchor”: “middle”, fill: cPoint
});
pa.textContent = ph.avg;
svg.appendChild(pa);
}
});
// Horizontal gridlines + y tick labels (skip a gridline at the reference y).
var refY = config.reference ? config.reference.y : null;
(ya.ticks || []).forEach(function (tv) {
var gy = yAt(tv);
if (refY === null || Math.abs(tv – refY) > 1e-9) {
svg.appendChild(el(“line”, {
“class”: “ghchart__gridline”, x1: M.left, y1: gy, x2: VB.w – M.right, y2: gy
}));
}
var yl = el(“text”, {
“class”: “ghchart__axislabel ghchart__axislabel–y”,
x: M.left – 16, y: gy, dy: “0.32em”, “text-anchor”: “end”
});
yl.textContent = fmtY(tv);
svg.appendChild(yl);
});
// X tick labels (dated).
(xa.ticks || []).forEach(function (t) {
var gx = xAt(t.at);
var first = Math.abs(t.at – xa.min) < 1e-9, last = Math.abs(t.at – xa.max) < 1e-9;
var xl = el("text", {
"class": "ghchart__axislabel ghchart__axislabel–x",
x: gx, y: baseY + 30, "text-anchor": first ? "start" : (last ? "end" : "middle")
});
xl.textContent = t.text;
svg.appendChild(xl);
});
// Axis titles.
if (ya.title) {
var ytX = 22, ytY = M.top + innerH / 2;
var yt = el("text", {
"class": "ghchart__axistitle", x: ytX, y: ytY, "text-anchor": "middle",
transform: "rotate(-90 " + ytX + " " + ytY + ")"
});
yt.textContent = ya.title;
svg.appendChild(yt);
}
// Trend: optional ±band (linear only), then the dashed line + slope label.
var tr = config.trend;
if (tr) {
function trendY(x) {
return tr.from.y + (tr.to.y – tr.from.y) * (x – tr.from.x) / (tr.to.x – tr.from.x);
}
if (tr.band && !isLog) {
var p = tr.band;
var pts = [
[xAt(tr.from.x), yAt(trendY(tr.from.x) + p)],
[xAt(tr.to.x), yAt(trendY(tr.to.x) + p)],
[xAt(tr.to.x), yAt(trendY(tr.to.x) – p)],
[xAt(tr.from.x), yAt(trendY(tr.from.x) – p)]
].map(function (a) { return a[0] + "," + a[1]; }).join(" ");
svg.appendChild(el("polygon", {
"class": "ghchart__trendband", points: pts, fill: cTrend
}));
}
svg.appendChild(el("line", {
"class": "ghchart__trendline",
x1: xAt(tr.from.x), y1: yAt(tr.from.y),
x2: xAt(tr.to.x), y2: yAt(tr.to.y), stroke: cTrend
}));
if (tr.label) {
var lx, lyy;
if (tr.labelAt) { lx = xAt(tr.labelAt.x); lyy = yAt(tr.labelAt.y); }
else {
lx = xAt(tr.to.x) + (tr.labelDX == null ? -6 : tr.labelDX);
lyy = yAt(tr.to.y) + (tr.labelDY == null ? -12 : tr.labelDY);
}
var sl = el("text", {
"class": "ghchart__slope", x: lx, y: lyy,
"text-anchor": tr.labelAnchor || "end", fill: cTrend
});
sl.textContent = tr.label;
svg.appendChild(sl);
}
}
// Reference line (horizontal dashed) + right-aligned label.
if (config.reference) {
var rc = config.reference.color || "#24292f";
var ryy = yAt(config.reference.y);
svg.appendChild(el("line", {
"class": "ghchart__refline", x1: M.left, y1: ryy, x2: VB.w – M.right, y2: ryy,
stroke: rc
}));
if (config.reference.label) {
var rl = el("text", {
"class": "ghchart__reflabel", x: VB.w – M.right, y: ryy – 8,
"text-anchor": "end", fill: rc
});
rl.textContent = config.reference.label;
svg.appendChild(rl);
}
}
// Data squares (values reveal on hover only).
var side = 13, hSide = side / 2;
var sqEls = [], hitEls = [];
(config.points || []).forEach(function (pt, i) {
var cx = xAt(pt.x), cy = yAt(pt.y);
var sq = el("rect", {
"class": "ghchart__square", x: cx – hSide, y: cy – hSide,
width: side, height: side, rx: 2, fill: cPoint
});
svg.appendChild(sq);
sqEls.push({ el: sq, cx: cx, cy: cy });
// Hover/focus hit target — omitted when hover is disabled so the
// (illustrative) point values never surface, on screen or to a11y.
if (!config.disableHover) {
var hit = el("rect", {
"class": "ghchart__squarehit", x: cx – 13, y: cy – 13,
width: 26, height: 26, tabindex: "0", role: "img",
"aria-label": (pt.d || "") + " " + fmtY(pt.y)
});
svg.appendChild(hit);
hitEls.push(hit);
}
});
// Invalid-run markers: red diamond + X, leader line, annotation text.
(config.invalids || []).forEach(function (iv) {
var cx = xAt(iv.x), cy = yAt(iv.y);
svg.appendChild(el("rect", {
"class": "ghchart__invalid", x: cx – hSide, y: cy – hSide,
width: side, height: side, rx: 1.5, fill: "none", stroke: cInvalid,
transform: "rotate(45 " + cx + " " + cy + ")"
}));
var q = 3.4;
svg.appendChild(el("line", {
"class": "ghchart__invalid-x", x1: cx – q, y1: cy – q, x2: cx + q, y2: cy + q,
stroke: cInvalid
}));
svg.appendChild(el("line", {
"class": "ghchart__invalid-x", x1: cx – q, y1: cy + q, x2: cx + q, y2: cy – q,
stroke: cInvalid
}));
if (iv.title) {
var tx = cx + (iv.labelDX == null ? 16 : iv.labelDX);
var ty = cy + (iv.labelDY == null ? -26 : iv.labelDY);
svg.appendChild(el("line", {
"class": "ghchart__leader", x1: cx, y1: cy, x2: tx, y2: ty, stroke: cInvalid
}));
var anchor = iv.labelAnchor || "start";
var at = el("text", {
"class": "ghchart__anno-title", x: tx, y: ty – 4, "text-anchor": anchor, fill: cInvalid
});
at.textContent = iv.title;
svg.appendChild(at);
if (iv.sub) {
var asu = el("text", {
"class": "ghchart__anno-sub", x: tx, y: ty + 11, "text-anchor": anchor
});
asu.textContent = iv.sub;
svg.appendChild(asu);
}
}
});
// Bracket annotation (span with end ticks + centered label above).
(config.brackets || []).forEach(function (b) {
var x0 = xAt(b.fromX), x1 = xAt(b.toX), by = yAt(b.y);
svg.appendChild(el("line", {
"class": "ghchart__bracket", x1: x0, y1: by, x2: x1, y2: by
}));
svg.appendChild(el("line", { "class": "ghchart__bracket", x1: x0, y1: by, x2: x0, y2: by + 7 }));
svg.appendChild(el("line", { "class": "ghchart__bracket", x1: x1, y1: by, x2: x1, y2: by + 7 }));
var bl = el("text", {
"class": "ghchart__bracket-label", x: (x0 + x1) / 2, y: by – 8, "text-anchor": "middle"
});
bl.textContent = b.text;
svg.appendChild(bl);
});
// Final callout: ringed point + leader + title/sub placed inside the plot.
if (config.callout) {
var co = config.callout;
var ccx = xAt(co.x), ccy = yAt(co.y);
svg.appendChild(el("circle", {
"class": "ghchart__callout-ring", cx: ccx, cy: ccy, r: 12, stroke: cPoint
}));
var ctx = ccx + (co.labelDX == null ? -16 : co.labelDX);
var cty = ccy + (co.labelDY == null ? -30 : co.labelDY);
svg.appendChild(el("line", {
"class": "ghchart__leader ghchart__leader–callout", x1: ccx, y1: ccy, x2: ctx, y2: cty,
stroke: cPoint
}));
var can = co.labelAnchor || "end";
var ct = el("text", {
"class": "ghchart__anno-title ghchart__anno-title–callout", x: ctx, y: cty – 4, "text-anchor": can, fill: cPoint
});
ct.textContent = co.title;
svg.appendChild(ct);
if (co.sub) {
var cs = el("text", {
"class": "ghchart__anno-sub ghchart__anno-sub–callout", x: ctx, y: cty + 12, "text-anchor": can
});
cs.textContent = co.sub;
svg.appendChild(cs);
}
}
root.appendChild(svg);
if (config.caption) {
var cap = html("div", "ghchart__caption");
cap.textContent = config.caption;
root.appendChild(cap);
}
/* —- Tooltip + hover interaction (skipped when disabled) —— */
if (!config.disableHover) {
var tip = html("div", "ghchart__tooltip");
tip.setAttribute("role", "status");
var tipTitle = html("div", "ghchart__tt-title");
var tipBody = html("div", "ghchart__tt-body");
tip.appendChild(tipTitle);
tip.appendChild(tipBody);
root.appendChild(tip);
var activeIndex = -1;
function show(i) {
var pt = config.points[i];
if (!pt) return;
var reappearing = activeIndex === -1;
activeIndex = i;
sqEls.forEach(function (s, si) {
var big = si === i;
var w = big ? side + 5 : side;
s.el.setAttribute("width", w);
s.el.setAttribute("height", w);
s.el.setAttribute("x", s.cx – w / 2);
s.el.setAttribute("y", s.cy – w / 2);
});
var tipInfo = config.pointTip
? config.pointTip(pt)
: { title: pt.d || "", line: fmtY(pt.y) };
tipTitle.textContent = tipInfo.title;
tipBody.textContent = "";
var line = html("div", "ghchart__tt-line");
line.textContent = tipInfo.line;
tipBody.appendChild(line);
var anchor = sqEls[i].el.getBoundingClientRect();
var rootRect = root.getBoundingClientRect();
var left = anchor.left + anchor.width / 2 – rootRect.left;
var top = anchor.top – rootRect.top – 12;
var suppress = reappearing && !reduceMotion();
if (suppress) tip.style.transition = "opacity 0.12s ease";
tip.setAttribute("data-visible", "true");
var halfW = tip.offsetWidth / 2;
left = clamp(left, halfW + 2, root.clientWidth – halfW – 2);
if (top – tip.offsetHeight < 0) {
top = anchor.bottom – rootRect.top + 12;
tip.style.transform = "translate(-50%, 0)";
} else {
tip.style.transform = "translate(-50%, -100%)";
}
tip.style.left = left + "px";
tip.style.top = top + "px";
if (suppress) { void tip.offsetWidth; tip.style.transition = ""; }
}
function hide() {
activeIndex = -1;
tip.setAttribute("data-visible", "false");
sqEls.forEach(function (s) {
s.el.setAttribute("width", side);
s.el.setAttribute("height", side);
s.el.setAttribute("x", s.cx – hSide);
s.el.setAttribute("y", s.cy – hSide);
});
}
hitEls.forEach(function (hit, i) {
hit.addEventListener("pointerenter", function () { show(i); });
hit.addEventListener("pointermove", function () { show(i); });
hit.addEventListener("pointerleave", hide);
hit.addEventListener("focus", function () { show(i); });
hit.addEventListener("blur", hide);
});
}
};
/* ================================================================
Distribution dashboard renderer
—————————————————————-
A composition figure (no hover — every value is printed as text, so
the marks are inherently screen-reader accessible):
• a compact narrative headline + muted subtitle;
• an optional segmented "mix" bar — proportional colored segments,
each with its name inside and count/percent below;
• one or more panels of ranked horizontal bars, each row printing
its category (left), a bar, and its count/percent (right).
Colors come from config.series so the harness can tune them live:
series[0] = bar fill (single base hex);
series[1..] = segment fills, in the order of config.segments.items.
================================================================ */
renderers.distribution = function (root, config) {
root.textContent = "";
root.setAttribute("role", "img");
if (config.title) root.setAttribute("aria-label", config.title);
var series = config.series || [];
var barColor = (series[0] && series[0].color) || "#8250df";
var total = config.total ||
(config.segments && config.segments.items
? config.segments.items.reduce(function (a, b) { return a + b.value; }, 0)
: 0);
function pctText(v) {
if (!total) return "";
return (Math.round((v / total) * 1000) / 10).toFixed(1) + "%";
}
function valueHTML(v) {
var p = pctText(v);
return "” + v + “” + (p ? ” (” + p + “)” : “”);
}
/* —- Headline + subtitle ————————————- */
if (config.title) {
var head = html(“div”, “ghchart__headline”);
head.textContent = config.title;
root.appendChild(head);
}
if (config.subtitle) {
var sub = html(“p”, “ghchart__subtitle”);
sub.textContent = config.subtitle;
root.appendChild(sub);
}
/* —- Segmented “mix” bar ————————————– */
var seg = config.segments;
if (seg && seg.items && seg.items.length) {
var segSec = html(“div”, “ghchart__dist-section”);
if (seg.title) {
var segTitle = html(“div”, “ghchart__panel-title”);
segTitle.textContent = seg.title;
segSec.appendChild(segTitle);
}
var segTotal = seg.items.reduce(function (a, b) { return a + b.value; }, 0) || 1;
var bar = html(“div”, “ghchart__seg”);
var notes = html(“div”, “ghchart__seg-note-row”);
seg.items.forEach(function (it, i) {
var basis = (it.value / segTotal) * 100;
var col = (series[i + 1] && series[i + 1].color) || it.color || barColor;
var cell = html(“div”, “ghchart__seg-cell”);
cell.style.flex = “0 0 ” + basis + “%”;
cell.style.background = col;
cell.textContent = it.label;
bar.appendChild(cell);
var note = html(“div”, “ghchart__seg-note”);
note.style.flex = “0 0 ” + basis + “%”;
note.innerHTML = valueHTML(it.value);
notes.appendChild(note);
});
segSec.appendChild(bar);
segSec.appendChild(notes);
root.appendChild(segSec);
}
/* —- Ranked bar panels (grid: 2-up, stacking on narrow) —— */
var panels = config.panels || [];
if (panels.length) {
var cols = html(“div”, “ghchart__dist-cols”);
if (config.columns === 1 || panels.length === 1) {
cols.classList.add(“ghchart__dist-cols–stack”);
}
panels.forEach(function (panel) {
var sec = html(“div”, “ghchart__dist-section”);
if (panel.title) {
var pt = html(“div”, “ghchart__panel-title”);
pt.textContent = panel.title;
sec.appendChild(pt);
}
var list = html(“div”, “ghchart__dist-list”);
var pmax = (panel.items || []).reduce(function (m, it) {
return it.value > m ? it.value : m;
}, 0) || 1;
(panel.items || []).forEach(function (it) {
var row = html(“div”, “ghchart__dist-row”);
var cat = html(“div”, “ghchart__dist-cat”);
cat.textContent = it.label;
row.appendChild(cat);
var track = html(“div”, “ghchart__dist-track”);
var b = html(“div”, “ghchart__dist-bar”);
b.style.width = Math.max((it.value / pmax) * 100, 1.2) + “%”;
b.style.background = it.color || barColor;
track.appendChild(b);
row.appendChild(track);
var val = html(“div”, “ghchart__dist-val”);
val.innerHTML = valueHTML(it.value);
row.appendChild(val);
list.appendChild(row);
});
sec.appendChild(list);
cols.appendChild(sec);
});
root.appendChild(cols);
}
/* —- Caption / footnote ————————————– */
if (config.caption) {
var cap = html(“div”, “ghchart__caption”);
cap.innerHTML = config.caption;
root.appendChild(cap);
}
};
/* ================================================================
Dispatcher — pick a renderer by config.type and draw into a mount
================================================================ */
function render(config, mountEl) {
var root = mountEl || document.getElementById(config.mountId);
if (!root) return;
root.classList.add(“ghchart”);
/* Resolve the renderer from the SHARED registry (see registration below),
not this bundle’s private `renderers`. When several exported charts share
one page they all merge into one registry, so every chart finds its
renderer even if an older engine bundle loaded first. */
var reg = (global.GHChartEngine && global.GHChartEngine.renderers) || renderers;
var fn = reg[config.type] || renderers[config.type] || reg.line || renderers.line;
fn(root, config);
}
/* —————————————————————-
Shared-engine registration (multi-embed safe)
—————————————————————-
Every exported chart.js embeds this whole engine. When two or more
charts are placed on the same page (e.g. a WordPress post), we must NOT
let the first-loaded bundle silently win — an older bundle would be
missing renderers added later (this is why a heatmap pasted after an
older bar chart used to vanish).
Instead we keep ONE shared engine:
• every bundle merges in any renderers the shared registry lacks;
• the newest bundle (highest ENGINE_VERSION) provides render(), which
reads renderers from the shared registry at call time.
The result is order-independent and resilient to version skew as new
chart types are added. Bump ENGINE_VERSION whenever renderers or render
change so a newer embed upgrades an older shared engine in place. */
var ENGINE_VERSION = 9;
var existing = global.GHChartEngine;
if (existing && typeof existing.version === “number”) {
if (ENGINE_VERSION > existing.version) {
/* This bundle is newer. Every export embeds the COMPLETE engine, so this
bundle’s `renderers` is a self-contained, up-to-date set. Adopt it as
the shared registry (upgrading older same-named renderers in place),
while defensively preserving any renderer types only the older engine
happened to have. Then take over render(). */
for (var ek in existing.renderers) {
if (Object.prototype.hasOwnProperty.call(existing.renderers, ek) && !renderers[ek]) {
renderers[ek] = existing.renderers[ek];
}
}
existing.renderers = renderers;
existing.render = render;
existing.version = ENGINE_VERSION;
} else {
/* Same or older version already present: only contribute renderer types
the shared registry is missing (don’t clobber an equal/newer engine). */
for (var rk in renderers) {
if (Object.prototype.hasOwnProperty.call(renderers, rk) && !existing.renderers[rk]) {
existing.renderers[rk] = renderers[rk];
}
}
}
} else {
/* No engine yet, or a pre-versioning (old-style) engine loaded first.
Take over, preserving any renderers the old-style engine registered. */
if (existing && existing.renderers) {
for (var ok in existing.renderers) {
if (Object.prototype.hasOwnProperty.call(existing.renderers, ok) && !renderers[ok]) {
renderers[ok] = existing.renderers[ok];
}
}
}
global.GHChartEngine = { renderers: renderers, render: render, version: ENGINE_VERSION };
}
})(typeof window !== “undefined” ? window : this);
;(function () {
“use strict”;
var CONFIG = {
mountId: “gh-chart-hf-deepswe”,
type: “scatter”,
title: “DeepSWE – GitHub Copilot CLI”,
xAxis: {
min: 0,
max: 4.5,
step: 0.5,
title: “Mean cost per task (USD)”,
format: function (v) { return “$” + v.toFixed(2); }
},
yAxis: {
min: 20,
max: 70,
step: 10,
title: “Resolution rate (pass@1)”,
format: function (v) { return v + “%”; }
},
tipSuffix: “/task”,
series: [
{
name: “HydraFusion”,
color: “#2da44f”
},
{
name: “Opus 5 (reference)”,
color: “#8250df”
},
{
name: “Other solo models”,
color: “#8c959f”
}
],
points: [
{
label: “HydraFusion”,
x: 2.7,
y: 62.6,
series: 0,
highlight: true,
labelPos: “above”
},
{
label: “Opus 5”,
x: 4.2,
y: 64.1,
series: 1,
reference: true,
labelPos: “above”
},
{
label: “GPT-5.6-Sol”,
x: 2.4,
y: 60.4,
series: 2,
labelPos: “below”
},
{
label: “Sonnet 5”,
x: 2.47,
y: 38.9,
series: 2,
labelPos: “right”
},
{
label: “GPT-5.6-Terra”,
x: 0.75,
y: 37.8,
series: 2,
labelPos: “right”
},
{
label: “GPT-5.6-Luna”,
x: 0.08,
y: 20.5,
series: 2,
labelPos: “right”
}
]
};
function boot() {
var root = document.getElementById(CONFIG.mountId);
if (!root || root.getAttribute(“data-gh-rendered”)) return;
root.setAttribute(“data-gh-rendered”, “1”);
window.GHChartEngine.render(CONFIG);
}
if (document.readyState === “loading”) {
document.addEventListener(“DOMContentLoaded”, boot);
} else {
boot();
}
})();
CheckpointBench
.ghchart {
/* Theme tokens */
–ghc-text: #1f2328;
–ghc-muted: #656d76;
–ghc-grid: #d0d7de;
–ghc-axis: #59636e;
–ghc-card-bg: #ffffff;
–ghc-card-border: #d0d7de;
–ghc-divider: #b6bfb8;
–ghc-guide: #afb8c1;
/* GitHub brand font — matches the github.blog stack (Mona Sans, with
the blog’s metric fallback) so it renders identically in-context. */
font-family: “Mona Sans”, “Mona Sans Fallback”, -apple-system, “system-ui”,
“Segoe UI”, Helvetica, Arial, sans-serif;
-webkit-font-smoothing: antialiased;
text-rendering: optimizeLegibility;
position: relative;
box-sizing: border-box;
width: 100%;
max-width: 699px;
margin: 0 auto;
color: var(–ghc-text);
line-height: 1.4;
}
.ghchart *,
.ghchart *::before,
.ghchart *::after { box-sizing: border-box; }
/* —————————————————————— */
/* Header + legend */
/* —————————————————————— */
.ghchart__header {
display: flex;
justify-content: flex-end;
align-items: center;
min-height: 24px;
margin-bottom: 4px;
}
.ghchart__legend {
display: flex;
align-items: center;
gap: 20px;
flex-wrap: wrap;
justify-content: flex-end;
}
.ghchart__legend-item {
display: inline-flex;
align-items: center;
gap: 8px;
font-size: clamp(14px, 1.9vw, 17px);
font-weight: 600;
color: var(–ghc-muted);
white-space: nowrap;
}
.ghchart__swatch {
width: 14px;
height: 14px;
border-radius: 4px;
flex: 0 0 auto;
}
/* —————————————————————— */
/* Plot (SVG) */
/* —————————————————————— */
.ghchart__plot {
display: block;
width: 100%;
height: auto;
overflow: visible;
touch-action: pan-y;
}
.ghchart__gridline {
stroke: var(–ghc-grid);
stroke-width: 1;
stroke-dasharray: 2 6;
stroke-linecap: round;
opacity: 0.9;
}
.ghchart__axislabel {
fill: var(–ghc-axis);
font-size: 22px;
font-weight: 500;
}
.ghchart__axislabel–x { font-weight: 600; }
.ghchart__line {
fill: none;
stroke-linecap: round;
stroke-linejoin: round;
}
.ghchart__dot { transition: r 0.12s ease; }
/* Dashed threshold line (e.g. a target/reference level) + floating label.
Stroke color is set inline per chart; dash + label styling live here. */
.ghchart__threshold {
stroke-width: 2;
stroke-dasharray: 7 6;
stroke-linecap: round;
opacity: 0.9;
}
.ghchart__threshold-label {
font-size: 20px;
font-weight: 700;
letter-spacing: -0.01em;
}
/* Hatched band marking a partial / projected trailing region. */
.ghchart__projection { pointer-events: none; }
.ghchart__guide {
stroke: var(–ghc-guide);
stroke-width: 1.5;
stroke-dasharray: 4 4;
opacity: 0;
transition: opacity 0.12s ease;
}
.ghchart__hit { fill: transparent; }
/* —————————————————————— */
/* Scatter plot */
/* —————————————————————— */
.ghchart__gridline–v { /* vertical gridlines reuse the dashed grid style */ }
.ghchart__axistitle {
fill: var(–ghc-muted);
font-size: 20px;
font-weight: 600;
letter-spacing: -0.01em;
}
/* Dotted reference crosshair through the “reference” point. Stroke color
is set inline (tracks the reference series color). */
.ghchart__crosshair {
stroke-width: 2;
stroke-dasharray: 2 7;
stroke-linecap: round;
opacity: 0.85;
pointer-events: none;
}
.ghchart__halo { opacity: 0.18; pointer-events: none; }
.ghchart__pt { transition: r 0.12s ease; }
.ghchart__pt-label {
fill: var(–ghc-muted);
font-size: 19px;
font-weight: 600;
letter-spacing: -0.01em;
pointer-events: none;
}
.ghchart__pt-label–strong { font-size: 21px; font-weight: 700; }
.ghchart__pthit { fill: transparent; cursor: default; outline: none; }
.ghchart__pthit:focus-visible {
outline: 2px solid var(–ghc-axis);
outline-offset: 1px;
}
.ghchart__swatch–dot { border-radius: 50%; }
/* —————————————————————— */
/* Trend chart (dated time-series with narrative headline) */
/* —————————————————————— */
.ghchart__headline {
font-size: clamp(17px, 2.3vw, 20px);
line-height: 1.32;
font-weight: 700;
letter-spacing: -0.01em;
color: var(–ghc-text);
margin: 0 0 8px;
}
/* Trend legend sits left-aligned under the headline/subtitle. */
.ghchart__legend–trend {
justify-content: flex-start;
margin: 2px 0 14px;
}
.ghchart__glyph { flex: 0 0 auto; }
.ghchart__glyph–square {
width: 13px; height: 13px; border-radius: 2px;
}
.ghchart__glyph–diamond {
width: 12px; height: 12px; border: 1.5px solid; transform: rotate(45deg);
}
.ghchart__glyph–line {
width: 20px; height: 0; border-top: 2px dashed; border-radius: 0;
}
/* Phase background columns + separators + top labels. */
.ghchart__phase { fill: #f6f8fa; opacity: 0.55; }
.ghchart__phase–alt { fill: #ffffff; opacity: 0; }
.ghchart__phase-sep {
stroke: var(–ghc-grid); stroke-width: 1; stroke-dasharray: 2 5; opacity: 0.8;
}
.ghchart__phase-label {
fill: var(–ghc-muted);
font-size: 15px;
font-weight: 700;
letter-spacing: 0.06em;
}
.ghchart__phase-avg {
font-size: 16px;
font-weight: 700;
letter-spacing: -0.01em;
}
/* Dashed trend line + ± noise band + slope label. */
.ghchart__trendband { opacity: 0.12; pointer-events: none; }
.ghchart__trendline {
stroke-width: 2.5;
stroke-dasharray: 8 6;
stroke-linecap: round;
fill: none;
}
.ghchart__slope {
font-size: 20px;
font-weight: 700;
letter-spacing: -0.01em;
}
/* Horizontal reference line + label. */
.ghchart__refline {
stroke-width: 2;
stroke-dasharray: 7 6;
stroke-linecap: round;
opacity: 0.85;
}
.ghchart__reflabel {
font-size: 16px;
font-weight: 700;
letter-spacing: -0.01em;
}
/* Data squares — values reveal on hover only. */
.ghchart__square { transition: width 0.12s ease, height 0.12s ease, x 0.12s ease, y 0.12s ease; }
.ghchart__squarehit { fill: transparent; cursor: default; outline: none; }
.ghchart__squarehit:focus-visible {
outline: 2px solid var(–ghc-axis);
outline-offset: 1px;
}
/* Invalid-run markers + leader-line annotations. */
.ghchart__invalid { stroke-width: 2; }
.ghchart__invalid-x { stroke-width: 2; stroke-linecap: round; }
.ghchart__leader { stroke-width: 1; stroke-dasharray: 2 3; opacity: 0.8; }
.ghchart__leader–callout { stroke-dasharray: none; opacity: 0.6; }
.ghchart__anno-title {
font-size: 15px;
font-weight: 700;
letter-spacing: -0.01em;
}
.ghchart__anno-sub {
fill: var(–ghc-muted);
font-size: 13px;
font-weight: 500;
}
/* Final-callout labels read a touch larger than the invalid-run notes. */
.ghchart__anno-title–callout { font-size: 17px; }
.ghchart__anno-sub–callout { font-size: 14px; }
/* Bracket span annotation. */
.ghchart__bracket { stroke: var(–ghc-axis); stroke-width: 1.5; opacity: 0.75; }
.ghchart__bracket-label {
fill: var(–ghc-muted);
font-size: 13px;
font-weight: 700;
letter-spacing: 0.04em;
}
/* Final callout ring. */
.ghchart__callout-ring { fill: none; stroke-width: 2; }
/* —————————————————————— */
/* Title + divider */
/* —————————————————————— */
.ghchart__title {
/* Matches the github.blog H2 (.wp-block-heading) exactly */
display: block;
font-size: 32px;
line-height: 40px;
font-weight: 700;
letter-spacing: -0.18px;
color: var(–ghc-text);
}
.ghchart__rule {
height: 1.5px;
border-radius: 1.5px;
background: var(–ghc-divider);
margin: 10px 0 18px;
}
/* —————————————————————— */
/* Bar chart: subtitle, panels, bars, caption */
/* —————————————————————— */
.ghchart__subtitle {
margin: -6px 0 20px;
font-size: clamp(13px, 1.6vw, 15px);
line-height: 1.5;
color: var(–ghc-muted);
}
.ghchart__panel { margin-top: 30px; }
.ghchart__panel:first-of-type { margin-top: 6px; }
.ghchart__panel-title {
margin: 0 0 6px;
font-size: clamp(15px, 1.9vw, 18px);
font-weight: 700;
letter-spacing: -0.01em;
color: var(–ghc-text);
}
.ghchart__plot–bar { touch-action: pan-y; }
.ghchart__axisline {
stroke: var(–ghc-axis);
stroke-width: 1.25;
opacity: 0.35;
}
.ghchart__bar { transition: opacity 0.12s ease; }
.ghchart__barhit { fill: transparent; }
/* Always-on value labels above selected bars. */
.ghchart__barvalue {
fill: var(–ghc-text);
font-size: 20px;
font-weight: 700;
font-variant-numeric: tabular-nums;
pointer-events: none;
}
/* Anchor annotation: dotted reference line + floating pill. */
.ghchart__anno-line {
stroke: #8b949e;
stroke-width: 1.5;
stroke-dasharray: 4 3;
stroke-linecap: round;
pointer-events: none;
}
.ghchart__anno-chip {
fill: #ffebe9;
stroke: #ffcecb;
stroke-width: 1;
pointer-events: none;
}
.ghchart__anno-chip-text {
fill: #a0111f;
font-weight: 700;
pointer-events: none;
}
.ghchart__caption {
margin-top: 22px;
padding-top: 12px;
border-top: 1px solid var(–ghc-card-border);
font-size: 12.5px;
line-height: 1.55;
color: var(–ghc-muted);
}
.ghchart__caption b { color: var(–ghc-text); font-weight: 700; }
.ghchart__caption code {
font-family: ui-monospace, SFMono-Regular, “SF Mono”, Menlo, Consolas, monospace;
font-size: 0.92em;
padding: 1px 5px;
background: #f6f8fa;
border: 1px solid var(–ghc-card-border);
border-radius: 5px;
}
.ghchart__tag {
display: inline-block;
font-size: 10px;
font-weight: 650;
letter-spacing: 0.03em;
text-transform: uppercase;
padding: 2px 7px;
border-radius: 999px;
border: 1px solid #aceebb;
color: #0a5223;
background: #dafbe1;
white-space: nowrap;
vertical-align: middle;
}
/* —————————————————————— */
/* Distribution dashboard (segmented mix bar + ranked bar panels) */
/* —————————————————————— */
.ghchart__dist-section { margin-top: 28px; }
.ghchart__dist-section:first-of-type { margin-top: 12px; }
/* Segmented proportional “mix” bar: name inside, count/percent below.
Separators are 2px inside borders (box-sizing:border-box) rather than a
flex gap, so the three segments sum to exactly 100% with no overflow. */
.ghchart__seg {
display: flex;
width: 100%;
height: 42px;
margin-top: 2px;
border-radius: 7px;
overflow: hidden;
}
.ghchart__seg-cell {
display: flex;
align-items: center;
justify-content: center;
min-width: 0;
color: #ffffff;
font-size: 15px;
font-weight: 700;
letter-spacing: -0.01em;
white-space: nowrap;
overflow: hidden;
}
.ghchart__seg-cell + .ghchart__seg-cell { border-left: 2px solid var(–ghc-card-bg); }
.ghchart__seg-note-row {
display: flex;
width: 100%;
margin-top: 8px;
}
.ghchart__seg-note {
min-width: 0;
text-align: center;
font-size: 12.5px;
color: var(–ghc-muted);
font-variant-numeric: tabular-nums;
white-space: nowrap;
}
/* Keep the outer notes from spilling past the chart edges. */
.ghchart__seg-note:first-child { text-align: left; }
.ghchart__seg-note:last-child { text-align: right; }
.ghchart__seg-note b { color: var(–ghc-text); font-weight: 700; }
/* Ranked horizontal bar list: [category | bar track | value].
The list is the grid and rows use display:contents, so the category,
bar, and value columns line up across every row in a panel. */
.ghchart__dist-list {
display: grid;
grid-template-columns: max-content 1fr max-content;
align-items: center;
column-gap: 12px;
row-gap: 10px;
margin-top: 4px;
}
.ghchart__dist-row { display: contents; }
.ghchart__dist-cat {
text-align: right;
font-size: 13px;
line-height: 1.25;
color: var(–ghc-text);
white-space: nowrap;
}
.ghchart__dist-track { width: 100%; }
.ghchart__dist-bar {
height: 15px;
min-width: 2px;
border-radius: 3px;
}
.ghchart__dist-val {
font-size: 12.5px;
color: var(–ghc-muted);
font-variant-numeric: tabular-nums;
white-space: nowrap;
}
.ghchart__dist-val b { color: var(–ghc-text); font-weight: 700; }
/* Two-up panel grid (collapses to one column on narrow screens).
minmax(0,1fr) lets columns shrink so long labels never force overflow. */
.ghchart__dist-cols {
margin-top: 26px;
display: grid;
grid-template-columns: repeat(2, minmax(0, 1fr));
gap: 24px 30px;
}
.ghchart__dist-cols .ghchart__dist-section { margin-top: 0; }
.ghchart__dist-cols–stack { grid-template-columns: 1fr; }
.ghchart__dist-cols–stack .ghchart__dist-section { margin-top: 28px; }
.ghchart__dist-cols–stack .ghchart__dist-section:first-child { margin-top: 0; }
/* Tighten the label/value type a touch in the 2-up layout so the bars
keep room at the 699px blog width. */
.ghchart__dist-cols:not(.ghchart__dist-cols–stack) .ghchart__dist-cat { font-size: 12px; }
.ghchart__dist-cols:not(.ghchart__dist-cols–stack) .ghchart__dist-val { font-size: 11.5px; }
.ghchart__dist-cols:not(.ghchart__dist-cols–stack) .ghchart__dist-list { column-gap: 9px; }
@media (max-width: 600px) {
.ghchart__dist-cols { grid-template-columns: 1fr; gap: 26px; }
.ghchart__dist-cols .ghchart__dist-section ~ .ghchart__dist-section { margin-top: 2px; }
}
/* Let long category labels wrap on very narrow (mobile) widths. */
@media (max-width: 480px) {
.ghchart__dist-cat { white-space: normal; }
}
/* —————————————————————— */
/* Calendar heatmap (GitHub contribution-graph style) */
/* —————————————————————— */
.ghheat__eyebrow { display: flex; align-items: center; gap: 8px; margin: 0 0 12px; }
.ghheat__eyedot {
width: 9px; height: 9px; border-radius: 50%;
background: #cf222e; box-shadow: 0 0 0 3px rgba(207, 34, 46, 0.14);
flex: 0 0 auto;
}
.ghheat__eyetext {
font-size: 12px; font-weight: 700; letter-spacing: 0.08em;
text-transform: uppercase; color: #cf222e;
}
/* Subtitle here is a prominent lede, not the muted variant. */
.ghheat__subtitle {
color: var(–ghc-text);
font-size: clamp(14px, 1.7vw, 16px);
/* 24px top gap matches the github.blog H2 → paragraph block spacing. */
margin: 24px 0 8px;
}
.ghheat__subtitle b { font-weight: 700; }
.ghheat__panel { margin-top: 36px; }
.ghheat__phead {
display: flex; align-items: baseline; gap: 9px; flex-wrap: wrap;
margin-bottom: 16px;
}
.ghheat__badge {
display: inline-flex; align-items: center; justify-content: center;
width: 22px; height: 22px; border-radius: 50%;
color: #fff; font-size: 12px; font-weight: 700;
flex: 0 0 auto; align-self: center;
}
.ghheat__ptitle {
font-size: clamp(16px, 2vw, 19px); font-weight: 700;
letter-spacing: -0.01em; color: var(–ghc-text);
}
.ghheat__pdesc { font-size: 14px; color: var(–ghc-muted); }
.ghheat__body { display: flex; gap: 30px; align-items: flex-start; flex-wrap: wrap; }
.ghheat__gridwrap { flex: 1 1 340px; min-width: 260px; }
.ghheat__grid { display: block; width: 100%; height: auto; overflow: visible; }
.ghheat__cell {
stroke: rgba(27, 31, 36, 0.06);
stroke-width: 1;
transition: stroke 0.1s ease;
}
.ghheat__cell:hover { stroke: #24292f; stroke-width: 1.4; }
.ghheat__cell–pad { opacity: 0; pointer-events: none; }
.ghheat__wd, .ghheat__month {
fill: var(–ghc-muted); font-size: 11px; font-weight: 600;
}
.ghheat__side { flex: 1 1 250px; min-width: 230px; }
.ghheat__stat { display: flex; align-items: baseline; gap: 7px; }
.ghheat__statbig {
font-size: clamp(26px, 4vw, 34px); font-weight: 800; letter-spacing: -0.02em;
line-height: 1;
}
.ghheat__statsmall { font-size: 15px; font-weight: 600; color: var(–ghc-muted); }
.ghheat__note {
margin: 10px 0 16px; font-size: 14px; line-height: 1.55; color: var(–ghc-muted);
}
.ghheat__note b { color: var(–ghc-text); font-weight: 700; }
.ghheat__legend {
display: flex; align-items: center; gap: 5px;
font-size: 12.5px; color: var(–ghc-muted); flex-wrap: wrap;
}
.ghheat__sw { width: 12px; height: 12px; border-radius: 3px; display: inline-block; flex: 0 0 auto; }
.ghheat__sw–empty { border: 1px solid #d0d7de; }
.ghheat__legunit { margin-left: 2px; }
.ghheat__extra {
display: flex; align-items: flex-start; gap: 7px; margin-top: 14px;
font-size: 12px; line-height: 1.5; color: var(–ghc-muted); max-width: 330px;
}
.ghheat__extra .ghheat__sw { margin-top: 2px; }
/* —————————————————————— */
/* Tooltip */
/* —————————————————————— */
.ghchart__tooltip {
position: absolute;
z-index: 5;
top: 0;
left: 0;
min-width: 128px;
max-width: 260px;
padding: 10px 12px;
background: var(–ghc-card-bg);
border: 1px solid var(–ghc-card-border);
border-radius: 12px;
/* Layered drop shadow from Primer Brand’s ActionMenu (.ActionMenu__menu) */
box-shadow:
0px 100px 80px rgba(0, 0, 0, 0.01),
0px 41px 33px rgba(0, 0, 0, 0.02),
0px 22px 17px rgba(0, 0, 0, 0.02),
0px 12px 10px rgba(0, 0, 0, 0.03),
0px 6px 5px rgba(0, 0, 0, 0.04),
0px 2px 2px rgba(0, 0, 0, 0.07);
pointer-events: none;
opacity: 0;
transform: translate(-50%, -100%);
/* Fade in on show and out on hide; quickly ease left/top when tracking
from one point to the next. The position ease is suppressed on the
first appearance (see chart.js) so the tooltip fades in place rather
than sliding in from its previous spot. */
transition: opacity 0.12s ease,
left 0.1s cubic-bezier(0.4, 0, 0.2, 1),
top 0.1s cubic-bezier(0.4, 0, 0.2, 1);
will-change: opacity, transform, left, top;
}
.ghchart__tooltip[data-visible=”true”] { opacity: 1; }
.ghchart__tt-title {
font-size: 13px;
font-weight: 700;
color: var(–ghc-text);
margin-bottom: 6px;
}
.ghchart__tt-row {
display: flex;
align-items: center;
gap: 8px;
font-size: 13px;
line-height: 1.6;
color: var(–ghc-muted);
}
.ghchart__tt-swatch { width: 10px; height: 10px; border-radius: 3px; flex: 0 0 auto; }
.ghchart__tt-name { flex: 1 1 auto; }
.ghchart__tt-value { font-weight: 700; color: var(–ghc-text); font-variant-numeric: tabular-nums; }
/* Bar tooltip body: a title line + free-form text lines (no swatches). */
.ghchart__tt-line {
font-size: 13px;
line-height: 1.5;
color: var(–ghc-muted);
}
.ghchart__tt-line:first-child { color: var(–ghc-text); font-weight: 600; }
.ghchart__tt-line + .ghchart__tt-line { margin-top: 2px; }
@media (prefers-reduced-motion: reduce) {
.ghchart__dot,
.ghchart__guide,
.ghchart__bar,
.ghchart__pt,
.ghchart__square,
.ghheat__cell,
.ghchart__tooltip { transition: none; }
}
/*
Shared chart engine — reusable renderer for the blog-charts library.
——————————————————————
Exposes window.GHChartEngine = { renderers, render(config, mountEl?) }.
Renderers are keyed by config.type (currently “line”); add a new viz type
by registering GHChartEngine.renderers[] = function (root, config) {…}.
This same file is embedded verbatim at the top of each exported WordPress
chart.js, followed by that chart’s CONFIG + a small auto-boot. It has no
external dependencies and is safe to include more than once on a page.
*/
(function (global) {
“use strict”;
var SVGNS = “http://www.w3.org/2000/svg”;
function el(tag, attrs) {
var node = document.createElementNS(SVGNS, tag);
if (attrs) {
for (var k in attrs) {
if (Object.prototype.hasOwnProperty.call(attrs, k)) {
node.setAttribute(k, attrs[k]);
}
}
}
return node;
}
function html(tag, cls) {
var node = document.createElement(tag);
if (cls) node.className = cls;
return node;
}
function clamp(v, lo, hi) { return v hi ? hi : v; }
var renderers = {};
/* ================================================================
Line chart renderer
================================================================ */
renderers.line = function (root, config) {
// viewBox geometry (design units; scales fluidly to any width).
var VB = { w: 1000, h: 560 };
var M = { top: 30, right: 34, bottom: 56, left: 86 };
// Inset the plotted points slightly from the axis so the first/last
// months (e.g. “Jan”) don’t crowd the y-axis labels (e.g. “50”).
var PAD_X = 18;
var innerW = VB.w – M.left – M.right;
var innerH = VB.h – M.top – M.bottom;
// Reset (in case of re-render) and use a unique id prefix so multiple
// charts on one page never share gradient ids.
root.textContent = “”;
var uid = config.mountId;
var n = config.labels.length;
var yMin = config.yAxis.min;
var yMax = config.yAxis.max;
var step = config.yAxis.step;
// Y-axis tick labels can format differently from the tooltip values
// (e.g. a plain “40” on the axis but “40%” in the tooltip).
var fmtAxis = config.formatAxis || config.formatValue;
var plotW = innerW – 2 * PAD_X;
var stepX = n <= 1 ? 0 : plotW / (n – 1);
function xAt(i) { return n <= 1 ? M.left + innerW / 2 : M.left + PAD_X + stepX * i; }
function yAt(v) { return M.top + innerH * (1 – (v – yMin) / (yMax – yMin)); }
var baseY = yAt(yMin);
/* —- Title + divider (top) ———————————- */
var title = html("span", "ghchart__title");
title.textContent = config.title;
root.appendChild(title);
root.appendChild(html("div", "ghchart__rule"));
/* —- Header + legend —————————————- */
if (!config.hideLegend) {
var header = html("div", "ghchart__header");
var legend = html("div", "ghchart__legend");
config.series.forEach(function (s) {
var item = html("span", "ghchart__legend-item");
var sw = html("span", "ghchart__swatch");
sw.style.background = s.color;
item.appendChild(sw);
item.appendChild(document.createTextNode(s.name));
legend.appendChild(item);
});
header.appendChild(legend);
root.appendChild(header);
}
/* —- SVG plot ———————————————– */
var svg = el("svg", {
"class": "ghchart__plot",
viewBox: "0 0 " + VB.w + " " + VB.h,
preserveAspectRatio: "xMidYMid meet",
role: "img",
"aria-label": config.title + " line chart"
});
// Gradient defs (one per area series).
var defs = el("defs");
config.series.forEach(function (s, si) {
if (!s.area) return;
var g = el("linearGradient", {
id: uid + "-grad-" + si, x1: "0", y1: "0", x2: "0", y2: "1"
});
g.appendChild(el("stop", { offset: "0", "stop-color": s.color, "stop-opacity": "0.28" }));
g.appendChild(el("stop", { offset: "0.55", "stop-color": s.color, "stop-opacity": "0.08" }));
g.appendChild(el("stop", { offset: "1", "stop-color": s.color, "stop-opacity": "0" }));
defs.appendChild(g);
});
// Diagonal-hatch pattern for an optional "partial / projected" band.
if (config.projection) {
var pat = el("pattern", {
id: uid + "-hatch", width: 7, height: 7,
patternUnits: "userSpaceOnUse", patternTransform: "rotate(45)"
});
pat.appendChild(el("line", {
x1: 0, y1: 0, x2: 0, y2: 7,
stroke: config.projection.color || "#8c959f",
"stroke-width": 1.1, "stroke-opacity": 0.5
}));
defs.appendChild(pat);
}
svg.appendChild(defs);
// Gridlines + y-axis labels.
for (var v = yMin; v cubic Bezier) path builder.
function smooth(points) {
if (!points.length) return “”;
if (points.length < 2) return "M" + points[0].x + "," + points[0].y;
var d = "M " + points[0].x + "," + points[0].y;
for (var i = 0; i < points.length – 1; i++) {
var p0 = points[i – 1] || points[i];
var p1 = points[i];
var p2 = points[i + 1];
var p3 = points[i + 2] || p2;
var t = 1 / 6;
var c1x = p1.x + (p2.x – p0.x) * t;
var c1y = p1.y + (p2.y – p0.y) * t;
var c2x = p2.x – (p3.x – p1.x) * t;
var c2y = p2.y – (p3.y – p1.y) * t;
d += " C " + c1x + "," + c1y + " " + c2x + "," + c2y + " " + p2.x + "," + p2.y;
}
return d;
}
// Area fills (drawn first, behind lines).
config.series.forEach(function (s, si) {
if (!s.area) return;
var p = pts[si];
var d = smooth(p) + " L " + p[p.length – 1].x + "," + baseY +
" L " + p[0].x + "," + baseY + " Z";
svg.appendChild(el("path", { d: d, fill: "url(#" + uid + "-grad-" + si + ")" }));
});
// Vertical hover guide (hidden until hover).
var guide = el("line", {
"class": "ghchart__guide",
x1: xAt(0), y1: M.top – 6, x2: xAt(0), y2: baseY
});
svg.appendChild(guide);
// Lines (draw in reverse so the first series sits on top).
config.series.slice().reverse().forEach(function (s) {
var si = config.series.indexOf(s);
svg.appendChild(el("path", {
"class": "ghchart__line",
d: smooth(pts[si]),
stroke: s.color,
"stroke-width": s.width || (si === 0 ? 4 : 3.25)
}));
});
// Dots (keep references for hover emphasis). When config.hideDots is set
// (dense daily lines), dots rest invisible and only the hovered one shows.
var dotEls = config.series.map(function (s, si) {
return pts[si].map(function (pt) {
var c = el("circle", {
"class": "ghchart__dot",
cx: pt.x, cy: pt.y,
r: config.hideDots ? 0 : (si === 0 ? 4.5 : 4),
fill: s.color
});
svg.appendChild(c);
return c;
});
});
// Transparent hit area for pointer capture.
var hit = el("rect", {
"class": "ghchart__hit",
x: M.left,
y: M.top – 6,
width: innerW,
height: baseY – M.top + 12
});
svg.appendChild(hit);
root.appendChild(svg);
/* —- Tooltip ———————————————— */
var tip = html("div", "ghchart__tooltip");
tip.setAttribute("role", "status");
var tipTitle = html("div", "ghchart__tt-title");
tip.appendChild(tipTitle);
var tipRows = config.series.map(function (s) {
var row = html("div", "ghchart__tt-row");
var sw = html("span", "ghchart__tt-swatch");
sw.style.background = s.color;
var name = html("span", "ghchart__tt-name");
name.textContent = s.name;
var val = html("span", "ghchart__tt-value");
row.appendChild(sw);
row.appendChild(name);
row.appendChild(val);
tip.appendChild(row);
return val;
});
root.appendChild(tip);
/* —- Hover / focus interactivity —————————- */
var activeIndex = -1;
var baseR = config.series.map(function (s, si) {
return config.hideDots ? 0 : (si === 0 ? 4.5 : 4);
});
// Radius of the single emphasized dot under the pointer.
var dotActiveR = config.series.map(function (s, si) {
return config.hideDots ? 6 : baseR[si] + 2.5;
});
var motionMQ = window.matchMedia
? window.matchMedia("(prefers-reduced-motion: reduce)")
: null;
function reduceMotion() { return !!(motionMQ && motionMQ.matches); }
function indexFromClientX(clientX) {
var rect = svg.getBoundingClientRect();
var relX = (clientX – rect.left) / rect.width * VB.w;
var i = stepX ? Math.round((relX – (M.left + PAD_X)) / stepX) : 0;
return clamp(i, 0, n – 1);
}
function show(i) {
if (i === activeIndex) return;
var reappearing = activeIndex === -1;
activeIndex = i;
guide.setAttribute("x1", xAt(i));
guide.setAttribute("x2", xAt(i));
guide.style.opacity = "1";
// Emphasize the hovered column's dots; reset the rest.
dotEls.forEach(function (col, si) {
col.forEach(function (c, ci) {
c.setAttribute("r", ci === i ? dotActiveR[si] : baseR[si]);
});
});
// Fill tooltip.
tipTitle.textContent = config.labels[i];
config.series.forEach(function (s, si) {
tipRows[si].textContent = config.formatValue(s.values[i]);
});
// Anchor above the highest point in this column.
var topSi = 0, topY = Infinity;
config.series.forEach(function (s, si) {
var yy = yAt(s.values[i]);
if (yy < topY) { topY = yy; topSi = si; }
});
var anchor = dotEls[topSi][i].getBoundingClientRect();
var rootRect = root.getBoundingClientRect();
var left = anchor.left + anchor.width / 2 – rootRect.left;
var top = anchor.top – rootRect.top – 12;
// On the first appearance, fade in exactly at the point: suppress the
// position ease so it doesn't slide in from its previous resting spot.
var suppress = reappearing && !reduceMotion();
if (suppress) tip.style.transition = "opacity 0.12s ease";
tip.setAttribute("data-visible", "true");
// Clamp horizontally within the container.
var halfW = tip.offsetWidth / 2;
left = clamp(left, halfW + 2, root.clientWidth – halfW – 2);
// Flip below the point if there's no room above.
if (top – tip.offsetHeight < 0) {
top = anchor.bottom – rootRect.top + 12;
tip.style.transform = "translate(-50%, 0)";
} else {
tip.style.transform = "translate(-50%, -100%)";
}
tip.style.left = left + "px";
tip.style.top = top + "px";
// Commit that position without animating, then restore the CSS
// transition so subsequent point-to-point moves ease into place.
if (suppress) {
void tip.offsetWidth;
tip.style.transition = "";
}
}
function hide() {
activeIndex = -1;
guide.style.opacity = "0";
tip.setAttribute("data-visible", "false");
dotEls.forEach(function (col, si) {
col.forEach(function (c) { c.setAttribute("r", baseR[si]); });
});
}
hit.addEventListener("pointermove", function (e) { show(indexFromClientX(e.clientX)); });
hit.addEventListener("pointerdown", function (e) { show(indexFromClientX(e.clientX)); });
hit.addEventListener("pointerleave", hide);
// Keyboard access.
svg.setAttribute("tabindex", "0");
svg.addEventListener("keydown", function (e) {
if (e.key === "ArrowRight" || e.key === "ArrowLeft") {
var start = activeIndex { title, lines:[…] } }
No printed value labels — values surface on hover (consistent with
the line chart). Bars use a single tunable color with rounded tops.
================================================================ */
renderers.bar = function (root, config) {
root.textContent = “”;
var barColor = (config.series && config.series[0] && config.series[0].color) || “#ff7b72”;
var barRadius = config.barRadius != null ? config.barRadius : 8;
// Per-bar fill: a bar may point at a different series (e.g. a muted
// “preliminary” color) via panel.barSeries[index]; otherwise series[0].
function barColorFor(panel, j) {
var si = (panel.barSeries && panel.barSeries[j] != null) ? panel.barSeries[j] : 0;
var s = config.series && config.series[si];
return (s && s.color) || barColor;
}
var motionMQ = window.matchMedia
? window.matchMedia(“(prefers-reduced-motion: reduce)”)
: null;
function reduceMotion() { return !!(motionMQ && motionMQ.matches); }
/* —- Title + divider (+ optional subtitle) —————— */
var title = html(“span”, “ghchart__title”);
title.textContent = config.title;
root.appendChild(title);
root.appendChild(html(“div”, “ghchart__rule”));
if (config.subtitle) {
var sub = html(“p”, “ghchart__subtitle”);
sub.textContent = config.subtitle;
root.appendChild(sub);
}
/* —- One shared tooltip for all panels ———————- */
var tip = html(“div”, “ghchart__tooltip”);
tip.setAttribute(“role”, “status”);
var tipTitle = html(“div”, “ghchart__tt-title”);
var tipBody = html(“div”, “ghchart__tt-body”);
tip.appendChild(tipTitle);
tip.appendChild(tipBody);
root.appendChild(tip);
var allBars = []; // { el, pi, bi }
var activeKey = null; // “pi:bi” of the hovered bar
function hideTip() {
activeKey = null;
tip.setAttribute(“data-visible”, “false”);
allBars.forEach(function (b) { b.el.style.opacity = “1”; });
}
// Hoisted: referenced by the per-column pointer handlers below.
function showTip(pi, bi, panel, panelBars) {
var reappearing = activeKey === null;
activeKey = pi + “:” + bi;
allBars.forEach(function (b) {
b.el.style.opacity = (b.pi === pi && b.bi === bi) ? “1” : “0.42”;
});
var content = panel.tooltip
? panel.tooltip(bi, panel)
: { title: (panel.labels || [])[bi],
lines: [ (panel.formatValue || String)(panel.values[bi]) ] };
tipTitle.textContent = content.title != null ? content.title : “”;
tipBody.textContent = “”;
(content.lines || []).forEach(function (ln) {
var row = html(“div”, “ghchart__tt-line”);
row.textContent = ln;
tipBody.appendChild(row);
});
var anchor = panelBars[bi].el.getBoundingClientRect();
var rootRect = root.getBoundingClientRect();
var left = anchor.left + anchor.width / 2 – rootRect.left;
var top = anchor.top – rootRect.top – 12;
var suppress = reappearing && !reduceMotion();
if (suppress) tip.style.transition = “opacity 0.12s ease”;
tip.setAttribute(“data-visible”, “true”);
var halfW = tip.offsetWidth / 2;
left = clamp(left, halfW + 2, root.clientWidth – halfW – 2);
if (top – tip.offsetHeight 0) {
for (var v = yMin; v <= yMax + 1e-9; v += step) {
var gy = yAt(v);
svg.appendChild(el("line", {
"class": "ghchart__gridline", x1: M.left, y1: gy, x2: VB.w – M.right, y2: gy
}));
var yl = el("text", {
"class": "ghchart__axislabel ghchart__axislabel–y",
x: M.left – 18, y: gy, dy: "0.32em", "text-anchor": "end"
});
yl.textContent = fmt(v);
svg.appendChild(yl);
}
}
// Solid baseline.
svg.appendChild(el("line", {
"class": "ghchart__axisline", x1: M.left, y1: baseY, x2: VB.w – M.right, y2: baseY
}));
// x-axis labels.
for (var i = 0; i < nb; i++) {
var xl = el("text", {
"class": "ghchart__axislabel ghchart__axislabel–x",
x: xCenter(i), y: VB.h – M.bottom + 30, "text-anchor": "middle"
});
if (panel.xLabelSize) xl.setAttribute("style", "font-size:" + panel.xLabelSize + "px");
xl.textContent = labels[i];
svg.appendChild(xl);
}
// Bars (rounded top corners only) + full-height hover columns.
var panelBars = [];
for (var j = 0; j dark ramp is derived from a single tunable base color.
================================================================ */
renderers.heatmap = function (root, config) {
root.textContent = “”;
var WHITE = [255, 255, 255], BLACK = [0, 0, 0];
function hexToRgb(h) {
h = String(h).replace(“#”, “”);
if (h.length === 3) h = h[0] + h[0] + h[1] + h[1] + h[2] + h[2];
return [parseInt(h.slice(0, 2), 16), parseInt(h.slice(2, 4), 16), parseInt(h.slice(4, 6), 16)];
}
function rgbToHex(c) {
return “#” + c.map(function (x) {
x = Math.max(0, Math.min(255, Math.round(x)));
return (x level 4 dark) from one hex.
function rampFrom(baseHex) {
var b = hexToRgb(baseHex);
return [
rgbToHex(mix(b, WHITE, 0.80)),
rgbToHex(mix(b, WHITE, 0.52)),
rgbToHex(mix(b, WHITE, 0.20)),
baseHex,
rgbToHex(mix(b, BLACK, 0.30))
];
}
function trim0(s) { return s.replace(/.0$/, “”); }
function fmtM(v) {
if (v >= 1000) { var g = v / 1000; return (g >= 10 ? Math.round(g) : trim0(g.toFixed(1))) + “B”; }
if (v >= 1) return trim0(v.toFixed(1)) + “M”;
return Math.round(v * 1000) + “K”;
}
var MON = [“Jan”, “Feb”, “Mar”, “Apr”, “May”, “Jun”, “Jul”, “Aug”, “Sep”, “Oct”, “Nov”, “Dec”];
var MON_FULL = [“January”, “February”, “March”, “April”, “May”, “June”,
“July”, “August”, “September”, “October”, “November”, “December”];
var WD = [“Sun”, “Mon”, “Tue”, “Wed”, “Thu”, “Fri”, “Sat”];
var year = config.year || 2026;
var startM = config.startMonth != null ? config.startMonth : 0;
var endM = config.endMonth != null ? config.endMonth : 5;
var emptyColor = config.emptyColor || “#ebedf0”;
function daysInMonth(y, m) { return new Date(y, m + 1, 0).getDate(); }
function parseISO(s) { var p = s.split(“-“); return new Date(+p[0], +p[1] – 1, +p[2]); }
function dayStart(dt) { return new Date(dt.getFullYear(), dt.getMonth(), dt.getDate()); }
/* —- Eyebrow + title + subtitle —————————– */
if (config.eyebrow) {
var eb = html(“div”, “ghheat__eyebrow”);
eb.appendChild(html(“span”, “ghheat__eyedot”));
var ebt = html(“span”, “ghheat__eyetext”);
ebt.textContent = config.eyebrow;
eb.appendChild(ebt);
root.appendChild(eb);
}
var title = html(“span”, “ghchart__title”);
title.textContent = config.title;
root.appendChild(title);
if (config.subtitle) {
var sub = html(“p”, “ghchart__subtitle ghheat__subtitle”);
sub.innerHTML = config.subtitle;
root.appendChild(sub);
}
/* —- One shared tooltip ————————————– */
var tip = html(“div”, “ghchart__tooltip”);
tip.setAttribute(“role”, “status”);
var tipTitle = html(“div”, “ghchart__tt-title”);
var tipBody = html(“div”, “ghchart__tt-body”);
tip.appendChild(tipTitle);
tip.appendChild(tipBody);
root.appendChild(tip);
var motionMQ = window.matchMedia ? window.matchMedia(“(prefers-reduced-motion: reduce)”) : null;
function reduceMotion() { return !!(motionMQ && motionMQ.matches); }
var activeCell = null;
function hideTip() { activeCell = null; tip.setAttribute(“data-visible”, “false”); }
function showTip(rectEl, titleText, lines) {
var reappearing = activeCell === null;
activeCell = rectEl;
tipTitle.textContent = titleText;
tipBody.textContent = “”;
lines.forEach(function (ln) {
var r = html(“div”, “ghchart__tt-line”);
r.innerHTML = ln;
tipBody.appendChild(r);
});
var a = rectEl.getBoundingClientRect(), rr = root.getBoundingClientRect();
var left = a.left + a.width / 2 – rr.left, top = a.top – rr.top – 12;
var suppress = reappearing && !reduceMotion();
if (suppress) tip.style.transition = “opacity 0.12s ease”;
tip.setAttribute(“data-visible”, “true”);
var halfW = tip.offsetWidth / 2;
left = clamp(left, halfW + 2, root.clientWidth – halfW – 2);
if (top – tip.offsetHeight < 0) {
top = a.bottom – rr.top + 12;
tip.style.transform = "translate(-50%, 0)";
} else {
tip.style.transform = "translate(-50%, -100%)";
}
tip.style.left = left + "px";
tip.style.top = top + "px";
if (suppress) { void tip.offsetWidth; tip.style.transition = ""; }
}
/* —- Panels ————————————————– */
(config.panels || []).forEach(function (panel, pi) {
var base = (config.series && config.series[pi] && config.series[pi].color) || panel.base || "#3094ff";
var ramp = rampFrom(base);
var strong = ramp[4];
var totals = panel.months || [];
var activeVals = [];
for (var mi = startM; mi <= endM; mi++) { if (totals[mi] != null) activeVals.push(totals[mi]); }
var vmin = activeVals.length ? Math.min.apply(null, activeVals) : 0;
var vmax = activeVals.length ? Math.max.apply(null, activeVals) : 1;
function levelFor(t) {
if (t == null) return -1;
if (vmax === vmin) return 4;
return Math.round((t – vmin) / (vmax – vmin) * 4);
}
var af = panel.activeFrom ? parseISO(panel.activeFrom) : new Date(year, startM, 1);
var at = panel.activeTo ? parseISO(panel.activeTo) : new Date(year, endM, daysInMonth(year, endM));
var wrap = html("div", "ghheat__panel");
var head = html("div", "ghheat__phead");
var badge = html("span", "ghheat__badge");
badge.textContent = panel.badge != null ? panel.badge : (pi + 1);
badge.style.background = strong;
head.appendChild(badge);
var pt = html("span", "ghheat__ptitle");
pt.textContent = panel.title;
head.appendChild(pt);
if (panel.descriptor) {
var pd = html("span", "ghheat__pdesc");
pd.textContent = panel.descriptor;
head.appendChild(pd);
}
wrap.appendChild(head);
var body = html("div", "ghheat__body");
/* —- Calendar grid (SVG) —- */
var gridStart = new Date(year, startM, 1);
var gs = new Date(gridStart);
gs.setDate(gs.getDate() – gs.getDay()); // back to Sunday
var gridEnd = new Date(year, endM, daysInMonth(year, endM));
var ge = new Date(gridEnd);
ge.setDate(ge.getDate() + (6 – ge.getDay())); // forward to Saturday
var nCols = Math.round((ge – gs) / (7 * 86400000)) + 1;
var cell = 13, sq = 11, rad = 2.5, labL = 34, labT = 18;
var W = labL + nCols * cell, H = labT + 7 * cell;
var svg = el("svg", {
"class": "ghheat__grid",
viewBox: "0 0 " + W + " " + H,
preserveAspectRatio: "xMinYMin meet",
role: "img",
"aria-label": panel.title + " calendar heatmap"
});
[1, 3, 5].forEach(function (r) {
var t = el("text", {
"class": "ghheat__wd", x: labL – 6, y: labT + r * cell + sq / 2,
dy: "0.32em", "text-anchor": "end"
});
t.textContent = WD[r];
svg.appendChild(t);
});
// Month labels above the column where each month begins.
for (var lm = startM; lm <= endM; lm++) {
var first = new Date(year, lm, 1);
var colOf = Math.floor((dayStart(first) – gs) / (7 * 86400000));
var mlab = el("text", { "class": "ghheat__month", x: labL + colOf * cell, y: 12, "text-anchor": "start" });
mlab.textContent = MON[lm];
svg.appendChild(mlab);
}
var afS = dayStart(af), atS = dayStart(at);
var d = new Date(gs);
for (var i = 0; i = startM && m = afS && ds = 0 ? ramp[lvl] : emptyColor
});
if (inRange) {
(function (dt, mm, has) {
var dateStr = WD[dt.getDay()] + ” u00b7 ” + MON[mm] + ” ” + dt.getDate() + “, ” + year;
var lines;
if (has) {
var daily = totals[mm] / daysInMonth(year, mm);
lines = [
“” + fmtM(daily) + “ ” + panel.legendLabel,
MON_FULL[mm] + ” u00b7 ” + fmtM(totals[mm]) + ” ” + panel.unitTotal
];
} else {
lines = [panel.emptyNote || “No vetted data”];
}
cellEl.addEventListener(“pointermove”, function () { showTip(cellEl, dateStr, lines); });
cellEl.addEventListener(“pointerdown”, function () { showTip(cellEl, dateStr, lines); });
cellEl.addEventListener(“pointerleave”, hideTip);
})(new Date(d), m, hasData);
} else {
cellEl.setAttribute(“class”, “ghheat__cell ghheat__cell–pad”);
}
svg.appendChild(cellEl);
d.setDate(d.getDate() + 1);
}
var gridwrap = html(“div”, “ghheat__gridwrap”);
gridwrap.appendChild(svg);
body.appendChild(gridwrap);
/* —- Side column: stat + note + legend + extra —- */
var side = html(“div”, “ghheat__side”);
if (panel.stat) {
var stat = html(“div”, “ghheat__stat”);
var big = html(“span”, “ghheat__statbig”);
big.textContent = panel.stat.big;
big.style.color = strong;
stat.appendChild(big);
if (panel.stat.small) {
var small = html(“span”, “ghheat__statsmall”);
small.textContent = panel.stat.small;
stat.appendChild(small);
}
side.appendChild(stat);
}
if (panel.note) {
var note = html(“p”, “ghheat__note”);
note.innerHTML = panel.note;
side.appendChild(note);
}
var leg = html(“div”, “ghheat__legend”);
var lw1 = html(“span”, “ghheat__legword”); lw1.textContent = “Fewer”; leg.appendChild(lw1);
ramp.forEach(function (c) {
var s = html(“span”, “ghheat__sw”); s.style.background = c; leg.appendChild(s);
});
var lw2 = html(“span”, “ghheat__legword”); lw2.textContent = “More”; leg.appendChild(lw2);
if (panel.legendLabel) {
var lu = html(“span”, “ghheat__legunit”); lu.textContent = “u00b7 ” + panel.legendLabel; leg.appendChild(lu);
}
side.appendChild(leg);
if (panel.extraNote) {
var ex = html(“div”, “ghheat__extra”);
var exsw = html(“span”, “ghheat__sw ghheat__sw–empty”);
exsw.style.background = emptyColor;
ex.appendChild(exsw);
var ext = html(“span”, “ghheat__extratext”);
ext.innerHTML = panel.extraNote;
ex.appendChild(ext);
side.appendChild(ex);
}
body.appendChild(side);
wrap.appendChild(body);
root.appendChild(wrap);
});
if (config.caption) {
var cap = html(“div”, “ghchart__caption”);
cap.innerHTML = config.caption;
root.appendChild(cap);
}
};
/* ================================================================
Scatter renderer — X/Y numeric plot with categorical points.
Used for cost-vs-quality benchmark charts: a highlighted “primary”
point (glow halo), a “reference” point with a dotted crosshair, and
muted “other” points. Values never print on the marks — a point’s
name shows for identity and the exact (y, x) reveals on hover.
================================================================ */
renderers.scatter = function (root, config) {
root.textContent = “”;
var uid = config.mountId;
var VB = { w: 1000, h: 600 };
var M = { top: 40, right: 30, bottom: 74, left: 96 };
var innerW = VB.w – M.left – M.right;
var innerH = VB.h – M.top – M.bottom;
var xa = config.xAxis, ya = config.yAxis;
var fmtX = xa.format || function (v) { return String(v); };
var fmtY = ya.format || function (v) { return String(v); };
var tipSuffix = config.tipSuffix || “”;
function xAt(v) { return M.left + innerW * (v – xa.min) / (xa.max – xa.min); }
function yAt(v) { return M.top + innerH * (1 – (v – ya.min) / (ya.max – ya.min)); }
var baseY = yAt(ya.min);
var motionMQ = window.matchMedia
? window.matchMedia(“(prefers-reduced-motion: reduce)”)
: null;
function reduceMotion() { return !!(motionMQ && motionMQ.matches); }
function colorOf(pt) {
var s = config.series && config.series[pt.series || 0];
return (s && s.color) || “#8c959f”;
}
/* —- Title (compact narrative headline, no rule) ———— */
var title = html(“div”, “ghchart__headline”);
title.textContent = config.title;
root.appendChild(title);
/* —- Header + legend (from series) ————————– */
if (!config.hideLegend) {
var header = html(“div”, “ghchart__header”);
var legend = html(“div”, “ghchart__legend”);
(config.series || []).forEach(function (s) {
var item = html(“span”, “ghchart__legend-item”);
var sw = html(“span”, “ghchart__swatch ghchart__swatch–dot”);
sw.style.background = s.color;
item.appendChild(sw);
item.appendChild(document.createTextNode(s.name));
legend.appendChild(item);
});
header.appendChild(legend);
root.appendChild(header);
}
/* —- SVG plot ———————————————– */
var svg = el(“svg”, {
“class”: “ghchart__plot ghchart__plot–scatter”,
viewBox: “0 0 ” + VB.w + ” ” + VB.h,
preserveAspectRatio: “xMidYMid meet”,
role: “img”,
“aria-label”: config.title + ” scatter plot”
});
// Gridlines (both directions) + tick labels.
var eps = 1e-6;
for (var yv = ya.min; yv <= ya.max + eps; yv += ya.step) {
var gy = yAt(yv);
svg.appendChild(el("line", {
"class": "ghchart__gridline",
x1: M.left, y1: gy, x2: VB.w – M.right, y2: gy
}));
var yl = el("text", {
"class": "ghchart__axislabel ghchart__axislabel–y",
x: M.left – 16, y: gy, dy: "0.32em", "text-anchor": "end"
});
yl.textContent = fmtY(yv);
svg.appendChild(yl);
}
for (var xv = xa.min; xv <= xa.max + eps; xv += xa.step) {
var gx = xAt(xv);
svg.appendChild(el("line", {
"class": "ghchart__gridline ghchart__gridline–v",
x1: gx, y1: M.top, x2: gx, y2: baseY
}));
var isFirst = Math.abs(xv – xa.min) < eps;
var isLast = Math.abs(xv – xa.max) < eps;
var xl = el("text", {
"class": "ghchart__axislabel ghchart__axislabel–x",
x: gx, y: baseY + 34,
"text-anchor": isFirst ? "start" : (isLast ? "end" : "middle")
});
xl.textContent = fmtX(xv);
svg.appendChild(xl);
}
// Axis titles.
if (xa.title) {
var xt = el("text", {
"class": "ghchart__axistitle",
x: M.left + innerW / 2, y: VB.h – 12, "text-anchor": "middle"
});
xt.textContent = xa.title;
svg.appendChild(xt);
}
if (ya.title) {
var ytX = 24, ytY = M.top + innerH / 2;
var yt = el("text", {
"class": "ghchart__axistitle",
x: ytX, y: ytY, "text-anchor": "middle",
transform: "rotate(-90 " + ytX + " " + ytY + ")"
});
yt.textContent = ya.title;
svg.appendChild(yt);
}
// Reference crosshair through the flagged point (dual dotted lines).
var refPt = (config.points || []).filter(function (p) { return p.reference; })[0];
if (refPt) {
var rColor = colorOf(refPt);
var rx = xAt(refPt.x), ry = yAt(refPt.y);
svg.appendChild(el("line", {
"class": "ghchart__crosshair",
x1: rx, y1: M.top, x2: rx, y2: baseY, stroke: rColor
}));
svg.appendChild(el("line", {
"class": "ghchart__crosshair",
x1: M.left, y1: ry, x2: VB.w – M.right, y2: ry, stroke: rColor
}));
}
// Points: halo (highlight/reference) + dot + name label.
var dotEls = [], hitEls = [];
(config.points || []).forEach(function (pt, i) {
var cx = xAt(pt.x), cy = yAt(pt.y), c = colorOf(pt);
var big = pt.highlight || pt.reference;
if (big) {
svg.appendChild(el("circle", {
"class": "ghchart__halo", cx: cx, cy: cy, r: 17, fill: c
}));
}
var dot = el("circle", {
"class": "ghchart__pt", cx: cx, cy: cy,
r: big ? 9 : 5.5, fill: c
});
svg.appendChild(dot);
dotEls.push({ el: dot, baseR: big ? 9 : 5.5 });
// Name label — bold+colored for the story points, muted for the rest.
var pos = pt.labelPos || (pt.highlight ? "below" : pt.reference ? "above" : "right");
var dx = 0, dy = 0, anchor = "middle";
var gap = big ? 15 : 9;
if (pos === "right") { dx = gap + 4; dy = 5; anchor = "start"; }
else if (pos === "left") { dx = -(gap + 4); dy = 5; anchor = "end"; }
else if (pos === "above") { dy = -(gap + 6); anchor = "middle"; }
else { dy = gap + 16; anchor = "middle"; } // below
var lbl = el("text", {
"class": "ghchart__pt-label" + (big ? " ghchart__pt-label–strong" : ""),
x: cx + dx, y: cy + dy, "text-anchor": anchor,
fill: big ? c : null
});
lbl.textContent = pt.label;
svg.appendChild(lbl);
// Transparent hit target for hover/focus.
var hit = el("circle", {
"class": "ghchart__pthit", cx: cx, cy: cy, r: 20,
tabindex: "0", role: "img",
"aria-label": pt.label + ": " + fmtY(pt.y) + ", " + fmtX(pt.x) + tipSuffix
});
svg.appendChild(hit);
hitEls.push(hit);
});
root.appendChild(svg);
/* —- Tooltip (title + free lines) ————————— */
var tip = html("div", "ghchart__tooltip");
tip.setAttribute("role", "status");
var tipTitle = html("div", "ghchart__tt-title");
var tipBody = html("div", "ghchart__tt-body");
tip.appendChild(tipTitle);
tip.appendChild(tipBody);
root.appendChild(tip);
var activeIndex = -1;
function show(i) {
var pt = config.points[i];
if (!pt) return;
var reappearing = activeIndex === -1;
activeIndex = i;
dotEls.forEach(function (d, di) {
d.el.setAttribute("r", di === i ? d.baseR + 2.5 : d.baseR);
});
tipTitle.textContent = pt.label;
tipBody.textContent = "";
var line = html("div", "ghchart__tt-line");
line.textContent = fmtY(pt.y) + " · " + fmtX(pt.x) + tipSuffix;
tipBody.appendChild(line);
var anchor = dotEls[i].el.getBoundingClientRect();
var rootRect = root.getBoundingClientRect();
var left = anchor.left + anchor.width / 2 – rootRect.left;
var top = anchor.top – rootRect.top – 12;
var suppress = reappearing && !reduceMotion();
if (suppress) tip.style.transition = "opacity 0.12s ease";
tip.setAttribute("data-visible", "true");
var halfW = tip.offsetWidth / 2;
left = clamp(left, halfW + 2, root.clientWidth – halfW – 2);
if (top – tip.offsetHeight 0) {
svg.appendChild(el(“line”, {
“class”: “ghchart__phase-sep”, x1: x0, y1: M.top, x2: x0, y2: baseY
}));
}
var pl = el(“text”, {
“class”: “ghchart__phase-label”, x: (x0 + x1) / 2, y: M.top – 40,
“text-anchor”: “middle”
});
pl.textContent = ph.label;
svg.appendChild(pl);
if (ph.avg) {
var pa = el(“text”, {
“class”: “ghchart__phase-avg”, x: (x0 + x1) / 2, y: M.top + 24,
“text-anchor”: “middle”, fill: cPoint
});
pa.textContent = ph.avg;
svg.appendChild(pa);
}
});
// Horizontal gridlines + y tick labels (skip a gridline at the reference y).
var refY = config.reference ? config.reference.y : null;
(ya.ticks || []).forEach(function (tv) {
var gy = yAt(tv);
if (refY === null || Math.abs(tv – refY) > 1e-9) {
svg.appendChild(el(“line”, {
“class”: “ghchart__gridline”, x1: M.left, y1: gy, x2: VB.w – M.right, y2: gy
}));
}
var yl = el(“text”, {
“class”: “ghchart__axislabel ghchart__axislabel–y”,
x: M.left – 16, y: gy, dy: “0.32em”, “text-anchor”: “end”
});
yl.textContent = fmtY(tv);
svg.appendChild(yl);
});
// X tick labels (dated).
(xa.ticks || []).forEach(function (t) {
var gx = xAt(t.at);
var first = Math.abs(t.at – xa.min) < 1e-9, last = Math.abs(t.at – xa.max) < 1e-9;
var xl = el("text", {
"class": "ghchart__axislabel ghchart__axislabel–x",
x: gx, y: baseY + 30, "text-anchor": first ? "start" : (last ? "end" : "middle")
});
xl.textContent = t.text;
svg.appendChild(xl);
});
// Axis titles.
if (ya.title) {
var ytX = 22, ytY = M.top + innerH / 2;
var yt = el("text", {
"class": "ghchart__axistitle", x: ytX, y: ytY, "text-anchor": "middle",
transform: "rotate(-90 " + ytX + " " + ytY + ")"
});
yt.textContent = ya.title;
svg.appendChild(yt);
}
// Trend: optional ±band (linear only), then the dashed line + slope label.
var tr = config.trend;
if (tr) {
function trendY(x) {
return tr.from.y + (tr.to.y – tr.from.y) * (x – tr.from.x) / (tr.to.x – tr.from.x);
}
if (tr.band && !isLog) {
var p = tr.band;
var pts = [
[xAt(tr.from.x), yAt(trendY(tr.from.x) + p)],
[xAt(tr.to.x), yAt(trendY(tr.to.x) + p)],
[xAt(tr.to.x), yAt(trendY(tr.to.x) – p)],
[xAt(tr.from.x), yAt(trendY(tr.from.x) – p)]
].map(function (a) { return a[0] + "," + a[1]; }).join(" ");
svg.appendChild(el("polygon", {
"class": "ghchart__trendband", points: pts, fill: cTrend
}));
}
svg.appendChild(el("line", {
"class": "ghchart__trendline",
x1: xAt(tr.from.x), y1: yAt(tr.from.y),
x2: xAt(tr.to.x), y2: yAt(tr.to.y), stroke: cTrend
}));
if (tr.label) {
var lx, lyy;
if (tr.labelAt) { lx = xAt(tr.labelAt.x); lyy = yAt(tr.labelAt.y); }
else {
lx = xAt(tr.to.x) + (tr.labelDX == null ? -6 : tr.labelDX);
lyy = yAt(tr.to.y) + (tr.labelDY == null ? -12 : tr.labelDY);
}
var sl = el("text", {
"class": "ghchart__slope", x: lx, y: lyy,
"text-anchor": tr.labelAnchor || "end", fill: cTrend
});
sl.textContent = tr.label;
svg.appendChild(sl);
}
}
// Reference line (horizontal dashed) + right-aligned label.
if (config.reference) {
var rc = config.reference.color || "#24292f";
var ryy = yAt(config.reference.y);
svg.appendChild(el("line", {
"class": "ghchart__refline", x1: M.left, y1: ryy, x2: VB.w – M.right, y2: ryy,
stroke: rc
}));
if (config.reference.label) {
var rl = el("text", {
"class": "ghchart__reflabel", x: VB.w – M.right, y: ryy – 8,
"text-anchor": "end", fill: rc
});
rl.textContent = config.reference.label;
svg.appendChild(rl);
}
}
// Data squares (values reveal on hover only).
var side = 13, hSide = side / 2;
var sqEls = [], hitEls = [];
(config.points || []).forEach(function (pt, i) {
var cx = xAt(pt.x), cy = yAt(pt.y);
var sq = el("rect", {
"class": "ghchart__square", x: cx – hSide, y: cy – hSide,
width: side, height: side, rx: 2, fill: cPoint
});
svg.appendChild(sq);
sqEls.push({ el: sq, cx: cx, cy: cy });
// Hover/focus hit target — omitted when hover is disabled so the
// (illustrative) point values never surface, on screen or to a11y.
if (!config.disableHover) {
var hit = el("rect", {
"class": "ghchart__squarehit", x: cx – 13, y: cy – 13,
width: 26, height: 26, tabindex: "0", role: "img",
"aria-label": (pt.d || "") + " " + fmtY(pt.y)
});
svg.appendChild(hit);
hitEls.push(hit);
}
});
// Invalid-run markers: red diamond + X, leader line, annotation text.
(config.invalids || []).forEach(function (iv) {
var cx = xAt(iv.x), cy = yAt(iv.y);
svg.appendChild(el("rect", {
"class": "ghchart__invalid", x: cx – hSide, y: cy – hSide,
width: side, height: side, rx: 1.5, fill: "none", stroke: cInvalid,
transform: "rotate(45 " + cx + " " + cy + ")"
}));
var q = 3.4;
svg.appendChild(el("line", {
"class": "ghchart__invalid-x", x1: cx – q, y1: cy – q, x2: cx + q, y2: cy + q,
stroke: cInvalid
}));
svg.appendChild(el("line", {
"class": "ghchart__invalid-x", x1: cx – q, y1: cy + q, x2: cx + q, y2: cy – q,
stroke: cInvalid
}));
if (iv.title) {
var tx = cx + (iv.labelDX == null ? 16 : iv.labelDX);
var ty = cy + (iv.labelDY == null ? -26 : iv.labelDY);
svg.appendChild(el("line", {
"class": "ghchart__leader", x1: cx, y1: cy, x2: tx, y2: ty, stroke: cInvalid
}));
var anchor = iv.labelAnchor || "start";
var at = el("text", {
"class": "ghchart__anno-title", x: tx, y: ty – 4, "text-anchor": anchor, fill: cInvalid
});
at.textContent = iv.title;
svg.appendChild(at);
if (iv.sub) {
var asu = el("text", {
"class": "ghchart__anno-sub", x: tx, y: ty + 11, "text-anchor": anchor
});
asu.textContent = iv.sub;
svg.appendChild(asu);
}
}
});
// Bracket annotation (span with end ticks + centered label above).
(config.brackets || []).forEach(function (b) {
var x0 = xAt(b.fromX), x1 = xAt(b.toX), by = yAt(b.y);
svg.appendChild(el("line", {
"class": "ghchart__bracket", x1: x0, y1: by, x2: x1, y2: by
}));
svg.appendChild(el("line", { "class": "ghchart__bracket", x1: x0, y1: by, x2: x0, y2: by + 7 }));
svg.appendChild(el("line", { "class": "ghchart__bracket", x1: x1, y1: by, x2: x1, y2: by + 7 }));
var bl = el("text", {
"class": "ghchart__bracket-label", x: (x0 + x1) / 2, y: by – 8, "text-anchor": "middle"
});
bl.textContent = b.text;
svg.appendChild(bl);
});
// Final callout: ringed point + leader + title/sub placed inside the plot.
if (config.callout) {
var co = config.callout;
var ccx = xAt(co.x), ccy = yAt(co.y);
svg.appendChild(el("circle", {
"class": "ghchart__callout-ring", cx: ccx, cy: ccy, r: 12, stroke: cPoint
}));
var ctx = ccx + (co.labelDX == null ? -16 : co.labelDX);
var cty = ccy + (co.labelDY == null ? -30 : co.labelDY);
svg.appendChild(el("line", {
"class": "ghchart__leader ghchart__leader–callout", x1: ccx, y1: ccy, x2: ctx, y2: cty,
stroke: cPoint
}));
var can = co.labelAnchor || "end";
var ct = el("text", {
"class": "ghchart__anno-title ghchart__anno-title–callout", x: ctx, y: cty – 4, "text-anchor": can, fill: cPoint
});
ct.textContent = co.title;
svg.appendChild(ct);
if (co.sub) {
var cs = el("text", {
"class": "ghchart__anno-sub ghchart__anno-sub–callout", x: ctx, y: cty + 12, "text-anchor": can
});
cs.textContent = co.sub;
svg.appendChild(cs);
}
}
root.appendChild(svg);
if (config.caption) {
var cap = html("div", "ghchart__caption");
cap.textContent = config.caption;
root.appendChild(cap);
}
/* —- Tooltip + hover interaction (skipped when disabled) —— */
if (!config.disableHover) {
var tip = html("div", "ghchart__tooltip");
tip.setAttribute("role", "status");
var tipTitle = html("div", "ghchart__tt-title");
var tipBody = html("div", "ghchart__tt-body");
tip.appendChild(tipTitle);
tip.appendChild(tipBody);
root.appendChild(tip);
var activeIndex = -1;
function show(i) {
var pt = config.points[i];
if (!pt) return;
var reappearing = activeIndex === -1;
activeIndex = i;
sqEls.forEach(function (s, si) {
var big = si === i;
var w = big ? side + 5 : side;
s.el.setAttribute("width", w);
s.el.setAttribute("height", w);
s.el.setAttribute("x", s.cx – w / 2);
s.el.setAttribute("y", s.cy – w / 2);
});
var tipInfo = config.pointTip
? config.pointTip(pt)
: { title: pt.d || "", line: fmtY(pt.y) };
tipTitle.textContent = tipInfo.title;
tipBody.textContent = "";
var line = html("div", "ghchart__tt-line");
line.textContent = tipInfo.line;
tipBody.appendChild(line);
var anchor = sqEls[i].el.getBoundingClientRect();
var rootRect = root.getBoundingClientRect();
var left = anchor.left + anchor.width / 2 – rootRect.left;
var top = anchor.top – rootRect.top – 12;
var suppress = reappearing && !reduceMotion();
if (suppress) tip.style.transition = "opacity 0.12s ease";
tip.setAttribute("data-visible", "true");
var halfW = tip.offsetWidth / 2;
left = clamp(left, halfW + 2, root.clientWidth – halfW – 2);
if (top – tip.offsetHeight < 0) {
top = anchor.bottom – rootRect.top + 12;
tip.style.transform = "translate(-50%, 0)";
} else {
tip.style.transform = "translate(-50%, -100%)";
}
tip.style.left = left + "px";
tip.style.top = top + "px";
if (suppress) { void tip.offsetWidth; tip.style.transition = ""; }
}
function hide() {
activeIndex = -1;
tip.setAttribute("data-visible", "false");
sqEls.forEach(function (s) {
s.el.setAttribute("width", side);
s.el.setAttribute("height", side);
s.el.setAttribute("x", s.cx – hSide);
s.el.setAttribute("y", s.cy – hSide);
});
}
hitEls.forEach(function (hit, i) {
hit.addEventListener("pointerenter", function () { show(i); });
hit.addEventListener("pointermove", function () { show(i); });
hit.addEventListener("pointerleave", hide);
hit.addEventListener("focus", function () { show(i); });
hit.addEventListener("blur", hide);
});
}
};
/* ================================================================
Distribution dashboard renderer
—————————————————————-
A composition figure (no hover — every value is printed as text, so
the marks are inherently screen-reader accessible):
• a compact narrative headline + muted subtitle;
• an optional segmented "mix" bar — proportional colored segments,
each with its name inside and count/percent below;
• one or more panels of ranked horizontal bars, each row printing
its category (left), a bar, and its count/percent (right).
Colors come from config.series so the harness can tune them live:
series[0] = bar fill (single base hex);
series[1..] = segment fills, in the order of config.segments.items.
================================================================ */
renderers.distribution = function (root, config) {
root.textContent = "";
root.setAttribute("role", "img");
if (config.title) root.setAttribute("aria-label", config.title);
var series = config.series || [];
var barColor = (series[0] && series[0].color) || "#8250df";
var total = config.total ||
(config.segments && config.segments.items
? config.segments.items.reduce(function (a, b) { return a + b.value; }, 0)
: 0);
function pctText(v) {
if (!total) return "";
return (Math.round((v / total) * 1000) / 10).toFixed(1) + "%";
}
/* Label format is config-driven so a chart can print counts, percents,
or both without a renderer change: config.valueFormat =
"both" (default) | "percent" | "count". Counts stay in the data either
way so the percentages are always derived from them. */
var valueFormat = config.valueFormat || "both";
function valueHTML(v) {
var p = pctText(v);
if (valueFormat === "percent") return p;
if (valueFormat === "count") return "” + v + ““;
return “” + v + “” + (p ? ” (” + p + “)” : “”);
}
/* —- Headline + subtitle ————————————- */
if (config.title) {
var head = html(“div”, “ghchart__headline”);
head.textContent = config.title;
root.appendChild(head);
}
if (config.subtitle) {
var sub = html(“p”, “ghchart__subtitle”);
sub.textContent = config.subtitle;
root.appendChild(sub);
}
/* —- Segmented “mix” bar ————————————– */
var seg = config.segments;
if (seg && seg.items && seg.items.length) {
var segSec = html(“div”, “ghchart__dist-section”);
if (seg.title) {
var segTitle = html(“div”, “ghchart__panel-title”);
segTitle.textContent = seg.title;
segSec.appendChild(segTitle);
}
var segTotal = seg.items.reduce(function (a, b) { return a + b.value; }, 0) || 1;
var bar = html(“div”, “ghchart__seg”);
var notes = html(“div”, “ghchart__seg-note-row”);
seg.items.forEach(function (it, i) {
var basis = (it.value / segTotal) * 100;
var col = (series[i + 1] && series[i + 1].color) || it.color || barColor;
var cell = html(“div”, “ghchart__seg-cell”);
cell.style.flex = “0 0 ” + basis + “%”;
cell.style.background = col;
cell.textContent = it.label;
bar.appendChild(cell);
var note = html(“div”, “ghchart__seg-note”);
note.style.flex = “0 0 ” + basis + “%”;
note.innerHTML = valueHTML(it.value);
notes.appendChild(note);
});
segSec.appendChild(bar);
segSec.appendChild(notes);
root.appendChild(segSec);
}
/* —- Ranked bar panels (grid: 2-up, stacking on narrow) —— */
var panels = config.panels || [];
if (panels.length) {
var cols = html(“div”, “ghchart__dist-cols”);
if (config.columns === 1 || panels.length === 1) {
cols.classList.add(“ghchart__dist-cols–stack”);
}
panels.forEach(function (panel) {
var sec = html(“div”, “ghchart__dist-section”);
if (panel.title) {
var pt = html(“div”, “ghchart__panel-title”);
pt.textContent = panel.title;
sec.appendChild(pt);
}
var list = html(“div”, “ghchart__dist-list”);
var pmax = (panel.items || []).reduce(function (m, it) {
return it.value > m ? it.value : m;
}, 0) || 1;
(panel.items || []).forEach(function (it) {
var row = html(“div”, “ghchart__dist-row”);
var cat = html(“div”, “ghchart__dist-cat”);
cat.textContent = it.label;
row.appendChild(cat);
var track = html(“div”, “ghchart__dist-track”);
var b = html(“div”, “ghchart__dist-bar”);
b.style.width = Math.max((it.value / pmax) * 100, 1.2) + “%”;
b.style.background = it.color || barColor;
track.appendChild(b);
row.appendChild(track);
var val = html(“div”, “ghchart__dist-val”);
val.innerHTML = valueHTML(it.value);
row.appendChild(val);
list.appendChild(row);
});
sec.appendChild(list);
cols.appendChild(sec);
});
root.appendChild(cols);
}
/* —- Caption / footnote ————————————– */
if (config.caption) {
var cap = html(“div”, “ghchart__caption”);
cap.innerHTML = config.caption;
root.appendChild(cap);
}
};
/* ================================================================
Dispatcher — pick a renderer by config.type and draw into a mount
================================================================ */
function render(config, mountEl) {
var root = mountEl || document.getElementById(config.mountId);
if (!root) return;
root.classList.add(“ghchart”);
/* Resolve the renderer from the SHARED registry (see registration below),
not this bundle’s private `renderers`. When several exported charts share
one page they all merge into one registry, so every chart finds its
renderer even if an older engine bundle loaded first. */
var reg = (global.GHChartEngine && global.GHChartEngine.renderers) || renderers;
var fn = reg[config.type] || renderers[config.type] || reg.line || renderers.line;
fn(root, config);
}
/* —————————————————————-
Shared-engine registration (multi-embed safe)
—————————————————————-
Every exported chart.js embeds this whole engine. When two or more
charts are placed on the same page (e.g. a WordPress post), we must NOT
let the first-loaded bundle silently win — an older bundle would be
missing renderers added later (this is why a heatmap pasted after an
older bar chart used to vanish).
Instead we keep ONE shared engine:
• every bundle merges in any renderers the shared registry lacks;
• the newest bundle (highest ENGINE_VERSION) provides render(), which
reads renderers from the shared registry at call time.
The result is order-independent and resilient to version skew as new
chart types are added. Bump ENGINE_VERSION whenever renderers or render
change so a newer embed upgrades an older shared engine in place. */
var ENGINE_VERSION = 10;
var existing = global.GHChartEngine;
if (existing && typeof existing.version === “number”) {
if (ENGINE_VERSION > existing.version) {
/* This bundle is newer. Every export embeds the COMPLETE engine, so this
bundle’s `renderers` is a self-contained, up-to-date set. Adopt it as
the shared registry (upgrading older same-named renderers in place),
while defensively preserving any renderer types only the older engine
happened to have. Then take over render(). */
for (var ek in existing.renderers) {
if (Object.prototype.hasOwnProperty.call(existing.renderers, ek) && !renderers[ek]) {
renderers[ek] = existing.renderers[ek];
}
}
existing.renderers = renderers;
existing.render = render;
existing.version = ENGINE_VERSION;
} else {
/* Same or older version already present: only contribute renderer types
the shared registry is missing (don’t clobber an equal/newer engine). */
for (var rk in renderers) {
if (Object.prototype.hasOwnProperty.call(renderers, rk) && !existing.renderers[rk]) {
existing.renderers[rk] = renderers[rk];
}
}
}
} else {
/* No engine yet, or a pre-versioning (old-style) engine loaded first.
Take over, preserving any renderers the old-style engine registered. */
if (existing && existing.renderers) {
for (var ok in existing.renderers) {
if (Object.prototype.hasOwnProperty.call(existing.renderers, ok) && !renderers[ok]) {
renderers[ok] = existing.renderers[ok];
}
}
}
global.GHChartEngine = { renderers: renderers, render: render, version: ENGINE_VERSION };
}
})(typeof window !== “undefined” ? window : this);
;(function () {
“use strict”;
var CONFIG = {
mountId: “gh-chart-cb-distribution”,
type: “distribution”,
title: “What’s inside CheckpointBench: real developer checkpoints”,
subtitle: “Distribution by programming language, task difficulty, and the kind of work the developer was doing”,
total: 276,
columns: 2,
valueFormat: “percent”,
series: [
{
name: “Bars”,
color: “#8250df”
},
{
name: “Easy”,
color: “#1a7f37”
},
{
name: “Medium”,
color: “#bf8700”
},
{
name: “Hard”,
color: “#cf222e”
}
],
segments: {
title: “Difficulty mix”,
items: [
{
label: “Easy”,
value: 116
},
{
label: “Medium”,
value: 107
},
{
label: “Hard”,
value: 53
}
]
},
panels: [
{
title: “Programming language”,
items: [
{
label: “Python family”,
value: 92
},
{
label: “TypeScript”,
value: 48
},
{
label: “C/C++”,
value: 27
},
{
label: “JavaScript”,
value: 21
},
{
label: “Unknown”,
value: 21
},
{
label: “HTML/CSS”,
value: 14
},
{
label: “C#”,
value: 13
},
{
label: “Shell”,
value: 13
},
{
label: “Go”,
value: 7
},
{
label: “Java”,
value: 4
},
{
label: “Rust”,
value: 4
}
]
},
{
title: “Task type”,
items: [
{
label: “Bug fix / debugging”,
value: 90
},
{
label: “Feature implementation”,
value: 73
},
{
label: “Code explanation / Q&A”,
value: 44
},
{
label: “Build / config / deployment”,
value: 22
},
{
label: “Planning / documentation”,
value: 19
},
{
label: “Unresolved”,
value: 13
},
{
label: “Refactor / maintenance”,
value: 8
},
{
label: “Testing / validation”,
value: 3
},
{
label: “Other”,
value: 3
},
{
label: “Data / ML / analysis”,
value: 1
}
]
}
]
};
function boot() {
var root = document.getElementById(CONFIG.mountId);
if (!root || root.getAttribute(“data-gh-rendered”)) return;
root.setAttribute(“data-gh-rendered”, “1”);
window.GHChartEngine.render(CONFIG);
}
if (document.readyState === “loading”) {
document.addEventListener(“DOMContentLoaded”, boot);
} else {
boot();
}
})();
CheckpointBench is an internal multi-turn benchmark curated from real GitHub Copilot agentic coding sessions. Each conversation is anchored to a specific public repository and immutable commit, ensuring every session is replayable. The benchmark is balanced across language, task type, difficulty, scrubbed for quality, resulting in a realistic evaluation set that closely mirrors production agentic sessions. On this benchmark, HydraFusion comes within 0.1 percentage points of Opus 5 at 65% lower cost.
.ghchart {
/* Theme tokens */
–ghc-text: #1f2328;
–ghc-muted: #656d76;
–ghc-grid: #d0d7de;
–ghc-axis: #59636e;
–ghc-card-bg: #ffffff;
–ghc-card-border: #d0d7de;
–ghc-divider: #b6bfb8;
–ghc-guide: #afb8c1;
/* GitHub brand font — matches the github.blog stack (Mona Sans, with
the blog’s metric fallback) so it renders identically in-context. */
font-family: “Mona Sans”, “Mona Sans Fallback”, -apple-system, “system-ui”,
“Segoe UI”, Helvetica, Arial, sans-serif;
-webkit-font-smoothing: antialiased;
text-rendering: optimizeLegibility;
position: relative;
box-sizing: border-box;
width: 100%;
max-width: 699px;
margin: 0 auto;
color: var(–ghc-text);
line-height: 1.4;
}
.ghchart *,
.ghchart *::before,
.ghchart *::after { box-sizing: border-box; }
/* —————————————————————— */
/* Header + legend */
/* —————————————————————— */
.ghchart__header {
display: flex;
justify-content: flex-end;
align-items: center;
min-height: 24px;
margin-bottom: 4px;
}
.ghchart__legend {
display: flex;
align-items: center;
gap: 20px;
flex-wrap: wrap;
justify-content: flex-end;
}
.ghchart__legend-item {
display: inline-flex;
align-items: center;
gap: 8px;
font-size: clamp(14px, 1.9vw, 17px);
font-weight: 600;
color: var(–ghc-muted);
white-space: nowrap;
}
.ghchart__swatch {
width: 14px;
height: 14px;
border-radius: 4px;
flex: 0 0 auto;
}
/* —————————————————————— */
/* Plot (SVG) */
/* —————————————————————— */
.ghchart__plot {
display: block;
width: 100%;
height: auto;
overflow: visible;
touch-action: pan-y;
}
.ghchart__gridline {
stroke: var(–ghc-grid);
stroke-width: 1;
stroke-dasharray: 2 6;
stroke-linecap: round;
opacity: 0.9;
}
.ghchart__axislabel {
fill: var(–ghc-axis);
font-size: 22px;
font-weight: 500;
}
.ghchart__axislabel–x { font-weight: 600; }
.ghchart__line {
fill: none;
stroke-linecap: round;
stroke-linejoin: round;
}
.ghchart__dot { transition: r 0.12s ease; }
/* Dashed threshold line (e.g. a target/reference level) + floating label.
Stroke color is set inline per chart; dash + label styling live here. */
.ghchart__threshold {
stroke-width: 2;
stroke-dasharray: 7 6;
stroke-linecap: round;
opacity: 0.9;
}
.ghchart__threshold-label {
font-size: 20px;
font-weight: 700;
letter-spacing: -0.01em;
}
/* Hatched band marking a partial / projected trailing region. */
.ghchart__projection { pointer-events: none; }
.ghchart__guide {
stroke: var(–ghc-guide);
stroke-width: 1.5;
stroke-dasharray: 4 4;
opacity: 0;
transition: opacity 0.12s ease;
}
.ghchart__hit { fill: transparent; }
/* —————————————————————— */
/* Scatter plot */
/* —————————————————————— */
.ghchart__gridline–v { /* vertical gridlines reuse the dashed grid style */ }
.ghchart__axistitle {
fill: var(–ghc-muted);
font-size: 20px;
font-weight: 600;
letter-spacing: -0.01em;
}
/* Dotted reference crosshair through the “reference” point. Stroke color
is set inline (tracks the reference series color). */
.ghchart__crosshair {
stroke-width: 2;
stroke-dasharray: 2 7;
stroke-linecap: round;
opacity: 0.85;
pointer-events: none;
}
.ghchart__halo { opacity: 0.18; pointer-events: none; }
.ghchart__pt { transition: r 0.12s ease; }
.ghchart__pt-label {
fill: var(–ghc-muted);
font-size: 19px;
font-weight: 600;
letter-spacing: -0.01em;
pointer-events: none;
}
.ghchart__pt-label–strong { font-size: 21px; font-weight: 700; }
.ghchart__pthit { fill: transparent; cursor: default; outline: none; }
.ghchart__pthit:focus-visible {
outline: 2px solid var(–ghc-axis);
outline-offset: 1px;
}
.ghchart__swatch–dot { border-radius: 50%; }
/* —————————————————————— */
/* Trend chart (dated time-series with narrative headline) */
/* —————————————————————— */
.ghchart__headline {
font-size: clamp(17px, 2.3vw, 20px);
line-height: 1.32;
font-weight: 700;
letter-spacing: -0.01em;
color: var(–ghc-text);
margin: 0 0 8px;
}
/* Trend legend sits left-aligned under the headline/subtitle. */
.ghchart__legend–trend {
justify-content: flex-start;
margin: 2px 0 14px;
}
.ghchart__glyph { flex: 0 0 auto; }
.ghchart__glyph–square {
width: 13px; height: 13px; border-radius: 2px;
}
.ghchart__glyph–diamond {
width: 12px; height: 12px; border: 1.5px solid; transform: rotate(45deg);
}
.ghchart__glyph–line {
width: 20px; height: 0; border-top: 2px dashed; border-radius: 0;
}
/* Phase background columns + separators + top labels. */
.ghchart__phase { fill: #f6f8fa; opacity: 0.55; }
.ghchart__phase–alt { fill: #ffffff; opacity: 0; }
.ghchart__phase-sep {
stroke: var(–ghc-grid); stroke-width: 1; stroke-dasharray: 2 5; opacity: 0.8;
}
.ghchart__phase-label {
fill: var(–ghc-muted);
font-size: 15px;
font-weight: 700;
letter-spacing: 0.06em;
}
.ghchart__phase-avg {
font-size: 16px;
font-weight: 700;
letter-spacing: -0.01em;
}
/* Dashed trend line + ± noise band + slope label. */
.ghchart__trendband { opacity: 0.12; pointer-events: none; }
.ghchart__trendline {
stroke-width: 2.5;
stroke-dasharray: 8 6;
stroke-linecap: round;
fill: none;
}
.ghchart__slope {
font-size: 20px;
font-weight: 700;
letter-spacing: -0.01em;
}
/* Horizontal reference line + label. */
.ghchart__refline {
stroke-width: 2;
stroke-dasharray: 7 6;
stroke-linecap: round;
opacity: 0.85;
}
.ghchart__reflabel {
font-size: 16px;
font-weight: 700;
letter-spacing: -0.01em;
}
/* Data squares — values reveal on hover only. */
.ghchart__square { transition: width 0.12s ease, height 0.12s ease, x 0.12s ease, y 0.12s ease; }
.ghchart__squarehit { fill: transparent; cursor: default; outline: none; }
.ghchart__squarehit:focus-visible {
outline: 2px solid var(–ghc-axis);
outline-offset: 1px;
}
/* Invalid-run markers + leader-line annotations. */
.ghchart__invalid { stroke-width: 2; }
.ghchart__invalid-x { stroke-width: 2; stroke-linecap: round; }
.ghchart__leader { stroke-width: 1; stroke-dasharray: 2 3; opacity: 0.8; }
.ghchart__leader–callout { stroke-dasharray: none; opacity: 0.6; }
.ghchart__anno-title {
font-size: 15px;
font-weight: 700;
letter-spacing: -0.01em;
}
.ghchart__anno-sub {
fill: var(–ghc-muted);
font-size: 13px;
font-weight: 500;
}
/* Final-callout labels read a touch larger than the invalid-run notes. */
.ghchart__anno-title–callout { font-size: 17px; }
.ghchart__anno-sub–callout { font-size: 14px; }
/* Bracket span annotation. */
.ghchart__bracket { stroke: var(–ghc-axis); stroke-width: 1.5; opacity: 0.75; }
.ghchart__bracket-label {
fill: var(–ghc-muted);
font-size: 13px;
font-weight: 700;
letter-spacing: 0.04em;
}
/* Final callout ring. */
.ghchart__callout-ring { fill: none; stroke-width: 2; }
/* —————————————————————— */
/* Title + divider */
/* —————————————————————— */
.ghchart__title {
/* Matches the github.blog H2 (.wp-block-heading) exactly */
display: block;
font-size: 32px;
line-height: 40px;
font-weight: 700;
letter-spacing: -0.18px;
color: var(–ghc-text);
}
.ghchart__rule {
height: 1.5px;
border-radius: 1.5px;
background: var(–ghc-divider);
margin: 10px 0 18px;
}
/* —————————————————————— */
/* Bar chart: subtitle, panels, bars, caption */
/* —————————————————————— */
.ghchart__subtitle {
margin: -6px 0 20px;
font-size: clamp(13px, 1.6vw, 15px);
line-height: 1.5;
color: var(–ghc-muted);
}
.ghchart__panel { margin-top: 30px; }
.ghchart__panel:first-of-type { margin-top: 6px; }
.ghchart__panel-title {
margin: 0 0 6px;
font-size: clamp(15px, 1.9vw, 18px);
font-weight: 700;
letter-spacing: -0.01em;
color: var(–ghc-text);
}
.ghchart__plot–bar { touch-action: pan-y; }
.ghchart__axisline {
stroke: var(–ghc-axis);
stroke-width: 1.25;
opacity: 0.35;
}
.ghchart__bar { transition: opacity 0.12s ease; }
.ghchart__barhit { fill: transparent; }
/* Always-on value labels above selected bars. */
.ghchart__barvalue {
fill: var(–ghc-text);
font-size: 20px;
font-weight: 700;
font-variant-numeric: tabular-nums;
pointer-events: none;
}
/* Anchor annotation: dotted reference line + floating pill. */
.ghchart__anno-line {
stroke: #8b949e;
stroke-width: 1.5;
stroke-dasharray: 4 3;
stroke-linecap: round;
pointer-events: none;
}
.ghchart__anno-chip {
fill: #ffebe9;
stroke: #ffcecb;
stroke-width: 1;
pointer-events: none;
}
.ghchart__anno-chip-text {
fill: #a0111f;
font-weight: 700;
pointer-events: none;
}
.ghchart__caption {
margin-top: 22px;
padding-top: 12px;
border-top: 1px solid var(–ghc-card-border);
font-size: 12.5px;
line-height: 1.55;
color: var(–ghc-muted);
}
.ghchart__caption b { color: var(–ghc-text); font-weight: 700; }
.ghchart__caption code {
font-family: ui-monospace, SFMono-Regular, “SF Mono”, Menlo, Consolas, monospace;
font-size: 0.92em;
padding: 1px 5px;
background: #f6f8fa;
border: 1px solid var(–ghc-card-border);
border-radius: 5px;
}
.ghchart__tag {
display: inline-block;
font-size: 10px;
font-weight: 650;
letter-spacing: 0.03em;
text-transform: uppercase;
padding: 2px 7px;
border-radius: 999px;
border: 1px solid #aceebb;
color: #0a5223;
background: #dafbe1;
white-space: nowrap;
vertical-align: middle;
}
/* —————————————————————— */
/* Distribution dashboard (segmented mix bar + ranked bar panels) */
/* —————————————————————— */
.ghchart__dist-section { margin-top: 28px; }
.ghchart__dist-section:first-of-type { margin-top: 12px; }
/* Segmented proportional “mix” bar: name inside, count/percent below.
Separators are 2px inside borders (box-sizing:border-box) rather than a
flex gap, so the three segments sum to exactly 100% with no overflow. */
.ghchart__seg {
display: flex;
width: 100%;
height: 42px;
margin-top: 2px;
border-radius: 7px;
overflow: hidden;
}
.ghchart__seg-cell {
display: flex;
align-items: center;
justify-content: center;
min-width: 0;
color: #ffffff;
font-size: 15px;
font-weight: 700;
letter-spacing: -0.01em;
white-space: nowrap;
overflow: hidden;
}
.ghchart__seg-cell + .ghchart__seg-cell { border-left: 2px solid var(–ghc-card-bg); }
.ghchart__seg-note-row {
display: flex;
width: 100%;
margin-top: 8px;
}
.ghchart__seg-note {
min-width: 0;
text-align: center;
font-size: 12.5px;
color: var(–ghc-muted);
font-variant-numeric: tabular-nums;
white-space: nowrap;
}
/* Keep the outer notes from spilling past the chart edges. */
.ghchart__seg-note:first-child { text-align: left; }
.ghchart__seg-note:last-child { text-align: right; }
.ghchart__seg-note b { color: var(–ghc-text); font-weight: 700; }
/* Ranked horizontal bar list: [category | bar track | value].
The list is the grid and rows use display:contents, so the category,
bar, and value columns line up across every row in a panel. */
.ghchart__dist-list {
display: grid;
grid-template-columns: max-content 1fr max-content;
align-items: center;
column-gap: 12px;
row-gap: 10px;
margin-top: 4px;
}
.ghchart__dist-row { display: contents; }
.ghchart__dist-cat {
text-align: right;
font-size: 13px;
line-height: 1.25;
color: var(–ghc-text);
white-space: nowrap;
}
.ghchart__dist-track { width: 100%; }
.ghchart__dist-bar {
height: 15px;
min-width: 2px;
border-radius: 3px;
}
.ghchart__dist-val {
font-size: 12.5px;
color: var(–ghc-muted);
font-variant-numeric: tabular-nums;
white-space: nowrap;
}
.ghchart__dist-val b { color: var(–ghc-text); font-weight: 700; }
/* Two-up panel grid (collapses to one column on narrow screens).
minmax(0,1fr) lets columns shrink so long labels never force overflow. */
.ghchart__dist-cols {
margin-top: 26px;
display: grid;
grid-template-columns: repeat(2, minmax(0, 1fr));
gap: 24px 30px;
}
.ghchart__dist-cols .ghchart__dist-section { margin-top: 0; }
.ghchart__dist-cols–stack { grid-template-columns: 1fr; }
.ghchart__dist-cols–stack .ghchart__dist-section { margin-top: 28px; }
.ghchart__dist-cols–stack .ghchart__dist-section:first-child { margin-top: 0; }
/* Tighten the label/value type a touch in the 2-up layout so the bars
keep room at the 699px blog width. */
.ghchart__dist-cols:not(.ghchart__dist-cols–stack) .ghchart__dist-cat { font-size: 12px; }
.ghchart__dist-cols:not(.ghchart__dist-cols–stack) .ghchart__dist-val { font-size: 11.5px; }
.ghchart__dist-cols:not(.ghchart__dist-cols–stack) .ghchart__dist-list { column-gap: 9px; }
@media (max-width: 600px) {
.ghchart__dist-cols { grid-template-columns: 1fr; gap: 26px; }
.ghchart__dist-cols .ghchart__dist-section ~ .ghchart__dist-section { margin-top: 2px; }
}
/* Let long category labels wrap on very narrow (mobile) widths. */
@media (max-width: 480px) {
.ghchart__dist-cat { white-space: normal; }
}
/* —————————————————————— */
/* Calendar heatmap (GitHub contribution-graph style) */
/* —————————————————————— */
.ghheat__eyebrow { display: flex; align-items: center; gap: 8px; margin: 0 0 12px; }
.ghheat__eyedot {
width: 9px; height: 9px; border-radius: 50%;
background: #cf222e; box-shadow: 0 0 0 3px rgba(207, 34, 46, 0.14);
flex: 0 0 auto;
}
.ghheat__eyetext {
font-size: 12px; font-weight: 700; letter-spacing: 0.08em;
text-transform: uppercase; color: #cf222e;
}
/* Subtitle here is a prominent lede, not the muted variant. */
.ghheat__subtitle {
color: var(–ghc-text);
font-size: clamp(14px, 1.7vw, 16px);
/* 24px top gap matches the github.blog H2 → paragraph block spacing. */
margin: 24px 0 8px;
}
.ghheat__subtitle b { font-weight: 700; }
.ghheat__panel { margin-top: 36px; }
.ghheat__phead {
display: flex; align-items: baseline; gap: 9px; flex-wrap: wrap;
margin-bottom: 16px;
}
.ghheat__badge {
display: inline-flex; align-items: center; justify-content: center;
width: 22px; height: 22px; border-radius: 50%;
color: #fff; font-size: 12px; font-weight: 700;
flex: 0 0 auto; align-self: center;
}
.ghheat__ptitle {
font-size: clamp(16px, 2vw, 19px); font-weight: 700;
letter-spacing: -0.01em; color: var(–ghc-text);
}
.ghheat__pdesc { font-size: 14px; color: var(–ghc-muted); }
.ghheat__body { display: flex; gap: 30px; align-items: flex-start; flex-wrap: wrap; }
.ghheat__gridwrap { flex: 1 1 340px; min-width: 260px; }
.ghheat__grid { display: block; width: 100%; height: auto; overflow: visible; }
.ghheat__cell {
stroke: rgba(27, 31, 36, 0.06);
stroke-width: 1;
transition: stroke 0.1s ease;
}
.ghheat__cell:hover { stroke: #24292f; stroke-width: 1.4; }
.ghheat__cell–pad { opacity: 0; pointer-events: none; }
.ghheat__wd, .ghheat__month {
fill: var(–ghc-muted); font-size: 11px; font-weight: 600;
}
.ghheat__side { flex: 1 1 250px; min-width: 230px; }
.ghheat__stat { display: flex; align-items: baseline; gap: 7px; }
.ghheat__statbig {
font-size: clamp(26px, 4vw, 34px); font-weight: 800; letter-spacing: -0.02em;
line-height: 1;
}
.ghheat__statsmall { font-size: 15px; font-weight: 600; color: var(–ghc-muted); }
.ghheat__note {
margin: 10px 0 16px; font-size: 14px; line-height: 1.55; color: var(–ghc-muted);
}
.ghheat__note b { color: var(–ghc-text); font-weight: 700; }
.ghheat__legend {
display: flex; align-items: center; gap: 5px;
font-size: 12.5px; color: var(–ghc-muted); flex-wrap: wrap;
}
.ghheat__sw { width: 12px; height: 12px; border-radius: 3px; display: inline-block; flex: 0 0 auto; }
.ghheat__sw–empty { border: 1px solid #d0d7de; }
.ghheat__legunit { margin-left: 2px; }
.ghheat__extra {
display: flex; align-items: flex-start; gap: 7px; margin-top: 14px;
font-size: 12px; line-height: 1.5; color: var(–ghc-muted); max-width: 330px;
}
.ghheat__extra .ghheat__sw { margin-top: 2px; }
/* —————————————————————— */
/* Tooltip */
/* —————————————————————— */
.ghchart__tooltip {
position: absolute;
z-index: 5;
top: 0;
left: 0;
min-width: 128px;
max-width: 260px;
padding: 10px 12px;
background: var(–ghc-card-bg);
border: 1px solid var(–ghc-card-border);
border-radius: 12px;
/* Layered drop shadow from Primer Brand’s ActionMenu (.ActionMenu__menu) */
box-shadow:
0px 100px 80px rgba(0, 0, 0, 0.01),
0px 41px 33px rgba(0, 0, 0, 0.02),
0px 22px 17px rgba(0, 0, 0, 0.02),
0px 12px 10px rgba(0, 0, 0, 0.03),
0px 6px 5px rgba(0, 0, 0, 0.04),
0px 2px 2px rgba(0, 0, 0, 0.07);
pointer-events: none;
opacity: 0;
transform: translate(-50%, -100%);
/* Fade in on show and out on hide; quickly ease left/top when tracking
from one point to the next. The position ease is suppressed on the
first appearance (see chart.js) so the tooltip fades in place rather
than sliding in from its previous spot. */
transition: opacity 0.12s ease,
left 0.1s cubic-bezier(0.4, 0, 0.2, 1),
top 0.1s cubic-bezier(0.4, 0, 0.2, 1);
will-change: opacity, transform, left, top;
}
.ghchart__tooltip[data-visible=”true”] { opacity: 1; }
.ghchart__tt-title {
font-size: 13px;
font-weight: 700;
color: var(–ghc-text);
margin-bottom: 6px;
}
.ghchart__tt-row {
display: flex;
align-items: center;
gap: 8px;
font-size: 13px;
line-height: 1.6;
color: var(–ghc-muted);
}
.ghchart__tt-swatch { width: 10px; height: 10px; border-radius: 3px; flex: 0 0 auto; }
.ghchart__tt-name { flex: 1 1 auto; }
.ghchart__tt-value { font-weight: 700; color: var(–ghc-text); font-variant-numeric: tabular-nums; }
/* Bar tooltip body: a title line + free-form text lines (no swatches). */
.ghchart__tt-line {
font-size: 13px;
line-height: 1.5;
color: var(–ghc-muted);
}
.ghchart__tt-line:first-child { color: var(–ghc-text); font-weight: 600; }
.ghchart__tt-line + .ghchart__tt-line { margin-top: 2px; }
@media (prefers-reduced-motion: reduce) {
.ghchart__dot,
.ghchart__guide,
.ghchart__bar,
.ghchart__pt,
.ghchart__square,
.ghheat__cell,
.ghchart__tooltip { transition: none; }
}
/*
Shared chart engine — reusable renderer for the blog-charts library.
——————————————————————
Exposes window.GHChartEngine = { renderers, render(config, mountEl?) }.
Renderers are keyed by config.type (currently “line”); add a new viz type
by registering GHChartEngine.renderers[] = function (root, config) {…}.
This same file is embedded verbatim at the top of each exported WordPress
chart.js, followed by that chart’s CONFIG + a small auto-boot. It has no
external dependencies and is safe to include more than once on a page.
*/
(function (global) {
“use strict”;
var SVGNS = “http://www.w3.org/2000/svg”;
function el(tag, attrs) {
var node = document.createElementNS(SVGNS, tag);
if (attrs) {
for (var k in attrs) {
if (Object.prototype.hasOwnProperty.call(attrs, k)) {
node.setAttribute(k, attrs[k]);
}
}
}
return node;
}
function html(tag, cls) {
var node = document.createElement(tag);
if (cls) node.className = cls;
return node;
}
function clamp(v, lo, hi) { return v hi ? hi : v; }
var renderers = {};
/* ================================================================
Line chart renderer
================================================================ */
renderers.line = function (root, config) {
// viewBox geometry (design units; scales fluidly to any width).
var VB = { w: 1000, h: 560 };
var M = { top: 30, right: 34, bottom: 56, left: 86 };
// Inset the plotted points slightly from the axis so the first/last
// months (e.g. “Jan”) don’t crowd the y-axis labels (e.g. “50”).
var PAD_X = 18;
var innerW = VB.w – M.left – M.right;
var innerH = VB.h – M.top – M.bottom;
// Reset (in case of re-render) and use a unique id prefix so multiple
// charts on one page never share gradient ids.
root.textContent = “”;
var uid = config.mountId;
var n = config.labels.length;
var yMin = config.yAxis.min;
var yMax = config.yAxis.max;
var step = config.yAxis.step;
// Y-axis tick labels can format differently from the tooltip values
// (e.g. a plain “40” on the axis but “40%” in the tooltip).
var fmtAxis = config.formatAxis || config.formatValue;
var plotW = innerW – 2 * PAD_X;
var stepX = n <= 1 ? 0 : plotW / (n – 1);
function xAt(i) { return n <= 1 ? M.left + innerW / 2 : M.left + PAD_X + stepX * i; }
function yAt(v) { return M.top + innerH * (1 – (v – yMin) / (yMax – yMin)); }
var baseY = yAt(yMin);
/* —- Title + divider (top) ———————————- */
var title = html("span", "ghchart__title");
title.textContent = config.title;
root.appendChild(title);
root.appendChild(html("div", "ghchart__rule"));
/* —- Header + legend —————————————- */
if (!config.hideLegend) {
var header = html("div", "ghchart__header");
var legend = html("div", "ghchart__legend");
config.series.forEach(function (s) {
var item = html("span", "ghchart__legend-item");
var sw = html("span", "ghchart__swatch");
sw.style.background = s.color;
item.appendChild(sw);
item.appendChild(document.createTextNode(s.name));
legend.appendChild(item);
});
header.appendChild(legend);
root.appendChild(header);
}
/* —- SVG plot ———————————————– */
var svg = el("svg", {
"class": "ghchart__plot",
viewBox: "0 0 " + VB.w + " " + VB.h,
preserveAspectRatio: "xMidYMid meet",
role: "img",
"aria-label": config.title + " line chart"
});
// Gradient defs (one per area series).
var defs = el("defs");
config.series.forEach(function (s, si) {
if (!s.area) return;
var g = el("linearGradient", {
id: uid + "-grad-" + si, x1: "0", y1: "0", x2: "0", y2: "1"
});
g.appendChild(el("stop", { offset: "0", "stop-color": s.color, "stop-opacity": "0.28" }));
g.appendChild(el("stop", { offset: "0.55", "stop-color": s.color, "stop-opacity": "0.08" }));
g.appendChild(el("stop", { offset: "1", "stop-color": s.color, "stop-opacity": "0" }));
defs.appendChild(g);
});
// Diagonal-hatch pattern for an optional "partial / projected" band.
if (config.projection) {
var pat = el("pattern", {
id: uid + "-hatch", width: 7, height: 7,
patternUnits: "userSpaceOnUse", patternTransform: "rotate(45)"
});
pat.appendChild(el("line", {
x1: 0, y1: 0, x2: 0, y2: 7,
stroke: config.projection.color || "#8c959f",
"stroke-width": 1.1, "stroke-opacity": 0.5
}));
defs.appendChild(pat);
}
svg.appendChild(defs);
// Gridlines + y-axis labels.
for (var v = yMin; v cubic Bezier) path builder.
function smooth(points) {
if (!points.length) return “”;
if (points.length < 2) return "M" + points[0].x + "," + points[0].y;
var d = "M " + points[0].x + "," + points[0].y;
for (var i = 0; i < points.length – 1; i++) {
var p0 = points[i – 1] || points[i];
var p1 = points[i];
var p2 = points[i + 1];
var p3 = points[i + 2] || p2;
var t = 1 / 6;
var c1x = p1.x + (p2.x – p0.x) * t;
var c1y = p1.y + (p2.y – p0.y) * t;
var c2x = p2.x – (p3.x – p1.x) * t;
var c2y = p2.y – (p3.y – p1.y) * t;
d += " C " + c1x + "," + c1y + " " + c2x + "," + c2y + " " + p2.x + "," + p2.y;
}
return d;
}
// Area fills (drawn first, behind lines).
config.series.forEach(function (s, si) {
if (!s.area) return;
var p = pts[si];
var d = smooth(p) + " L " + p[p.length – 1].x + "," + baseY +
" L " + p[0].x + "," + baseY + " Z";
svg.appendChild(el("path", { d: d, fill: "url(#" + uid + "-grad-" + si + ")" }));
});
// Vertical hover guide (hidden until hover).
var guide = el("line", {
"class": "ghchart__guide",
x1: xAt(0), y1: M.top – 6, x2: xAt(0), y2: baseY
});
svg.appendChild(guide);
// Lines (draw in reverse so the first series sits on top).
config.series.slice().reverse().forEach(function (s) {
var si = config.series.indexOf(s);
svg.appendChild(el("path", {
"class": "ghchart__line",
d: smooth(pts[si]),
stroke: s.color,
"stroke-width": s.width || (si === 0 ? 4 : 3.25)
}));
});
// Dots (keep references for hover emphasis). When config.hideDots is set
// (dense daily lines), dots rest invisible and only the hovered one shows.
var dotEls = config.series.map(function (s, si) {
return pts[si].map(function (pt) {
var c = el("circle", {
"class": "ghchart__dot",
cx: pt.x, cy: pt.y,
r: config.hideDots ? 0 : (si === 0 ? 4.5 : 4),
fill: s.color
});
svg.appendChild(c);
return c;
});
});
// Transparent hit area for pointer capture.
var hit = el("rect", {
"class": "ghchart__hit",
x: M.left,
y: M.top – 6,
width: innerW,
height: baseY – M.top + 12
});
svg.appendChild(hit);
root.appendChild(svg);
/* —- Tooltip ———————————————— */
var tip = html("div", "ghchart__tooltip");
tip.setAttribute("role", "status");
var tipTitle = html("div", "ghchart__tt-title");
tip.appendChild(tipTitle);
var tipRows = config.series.map(function (s) {
var row = html("div", "ghchart__tt-row");
var sw = html("span", "ghchart__tt-swatch");
sw.style.background = s.color;
var name = html("span", "ghchart__tt-name");
name.textContent = s.name;
var val = html("span", "ghchart__tt-value");
row.appendChild(sw);
row.appendChild(name);
row.appendChild(val);
tip.appendChild(row);
return val;
});
root.appendChild(tip);
/* —- Hover / focus interactivity —————————- */
var activeIndex = -1;
var baseR = config.series.map(function (s, si) {
return config.hideDots ? 0 : (si === 0 ? 4.5 : 4);
});
// Radius of the single emphasized dot under the pointer.
var dotActiveR = config.series.map(function (s, si) {
return config.hideDots ? 6 : baseR[si] + 2.5;
});
var motionMQ = window.matchMedia
? window.matchMedia("(prefers-reduced-motion: reduce)")
: null;
function reduceMotion() { return !!(motionMQ && motionMQ.matches); }
function indexFromClientX(clientX) {
var rect = svg.getBoundingClientRect();
var relX = (clientX – rect.left) / rect.width * VB.w;
var i = stepX ? Math.round((relX – (M.left + PAD_X)) / stepX) : 0;
return clamp(i, 0, n – 1);
}
function show(i) {
if (i === activeIndex) return;
var reappearing = activeIndex === -1;
activeIndex = i;
guide.setAttribute("x1", xAt(i));
guide.setAttribute("x2", xAt(i));
guide.style.opacity = "1";
// Emphasize the hovered column's dots; reset the rest.
dotEls.forEach(function (col, si) {
col.forEach(function (c, ci) {
c.setAttribute("r", ci === i ? dotActiveR[si] : baseR[si]);
});
});
// Fill tooltip.
tipTitle.textContent = config.labels[i];
config.series.forEach(function (s, si) {
tipRows[si].textContent = config.formatValue(s.values[i]);
});
// Anchor above the highest point in this column.
var topSi = 0, topY = Infinity;
config.series.forEach(function (s, si) {
var yy = yAt(s.values[i]);
if (yy < topY) { topY = yy; topSi = si; }
});
var anchor = dotEls[topSi][i].getBoundingClientRect();
var rootRect = root.getBoundingClientRect();
var left = anchor.left + anchor.width / 2 – rootRect.left;
var top = anchor.top – rootRect.top – 12;
// On the first appearance, fade in exactly at the point: suppress the
// position ease so it doesn't slide in from its previous resting spot.
var suppress = reappearing && !reduceMotion();
if (suppress) tip.style.transition = "opacity 0.12s ease";
tip.setAttribute("data-visible", "true");
// Clamp horizontally within the container.
var halfW = tip.offsetWidth / 2;
left = clamp(left, halfW + 2, root.clientWidth – halfW – 2);
// Flip below the point if there's no room above.
if (top – tip.offsetHeight < 0) {
top = anchor.bottom – rootRect.top + 12;
tip.style.transform = "translate(-50%, 0)";
} else {
tip.style.transform = "translate(-50%, -100%)";
}
tip.style.left = left + "px";
tip.style.top = top + "px";
// Commit that position without animating, then restore the CSS
// transition so subsequent point-to-point moves ease into place.
if (suppress) {
void tip.offsetWidth;
tip.style.transition = "";
}
}
function hide() {
activeIndex = -1;
guide.style.opacity = "0";
tip.setAttribute("data-visible", "false");
dotEls.forEach(function (col, si) {
col.forEach(function (c) { c.setAttribute("r", baseR[si]); });
});
}
hit.addEventListener("pointermove", function (e) { show(indexFromClientX(e.clientX)); });
hit.addEventListener("pointerdown", function (e) { show(indexFromClientX(e.clientX)); });
hit.addEventListener("pointerleave", hide);
// Keyboard access.
svg.setAttribute("tabindex", "0");
svg.addEventListener("keydown", function (e) {
if (e.key === "ArrowRight" || e.key === "ArrowLeft") {
var start = activeIndex { title, lines:[…] } }
No printed value labels — values surface on hover (consistent with
the line chart). Bars use a single tunable color with rounded tops.
================================================================ */
renderers.bar = function (root, config) {
root.textContent = “”;
var barColor = (config.series && config.series[0] && config.series[0].color) || “#ff7b72”;
var barRadius = config.barRadius != null ? config.barRadius : 8;
// Per-bar fill: a bar may point at a different series (e.g. a muted
// “preliminary” color) via panel.barSeries[index]; otherwise series[0].
function barColorFor(panel, j) {
var si = (panel.barSeries && panel.barSeries[j] != null) ? panel.barSeries[j] : 0;
var s = config.series && config.series[si];
return (s && s.color) || barColor;
}
var motionMQ = window.matchMedia
? window.matchMedia(“(prefers-reduced-motion: reduce)”)
: null;
function reduceMotion() { return !!(motionMQ && motionMQ.matches); }
/* —- Title + divider (+ optional subtitle) —————— */
var title = html(“span”, “ghchart__title”);
title.textContent = config.title;
root.appendChild(title);
root.appendChild(html(“div”, “ghchart__rule”));
if (config.subtitle) {
var sub = html(“p”, “ghchart__subtitle”);
sub.textContent = config.subtitle;
root.appendChild(sub);
}
/* —- One shared tooltip for all panels ———————- */
var tip = html(“div”, “ghchart__tooltip”);
tip.setAttribute(“role”, “status”);
var tipTitle = html(“div”, “ghchart__tt-title”);
var tipBody = html(“div”, “ghchart__tt-body”);
tip.appendChild(tipTitle);
tip.appendChild(tipBody);
root.appendChild(tip);
var allBars = []; // { el, pi, bi }
var activeKey = null; // “pi:bi” of the hovered bar
function hideTip() {
activeKey = null;
tip.setAttribute(“data-visible”, “false”);
allBars.forEach(function (b) { b.el.style.opacity = “1”; });
}
// Hoisted: referenced by the per-column pointer handlers below.
function showTip(pi, bi, panel, panelBars) {
var reappearing = activeKey === null;
activeKey = pi + “:” + bi;
allBars.forEach(function (b) {
b.el.style.opacity = (b.pi === pi && b.bi === bi) ? “1” : “0.42”;
});
var content = panel.tooltip
? panel.tooltip(bi, panel)
: { title: (panel.labels || [])[bi],
lines: [ (panel.formatValue || String)(panel.values[bi]) ] };
tipTitle.textContent = content.title != null ? content.title : “”;
tipBody.textContent = “”;
(content.lines || []).forEach(function (ln) {
var row = html(“div”, “ghchart__tt-line”);
row.textContent = ln;
tipBody.appendChild(row);
});
var anchor = panelBars[bi].el.getBoundingClientRect();
var rootRect = root.getBoundingClientRect();
var left = anchor.left + anchor.width / 2 – rootRect.left;
var top = anchor.top – rootRect.top – 12;
var suppress = reappearing && !reduceMotion();
if (suppress) tip.style.transition = “opacity 0.12s ease”;
tip.setAttribute(“data-visible”, “true”);
var halfW = tip.offsetWidth / 2;
left = clamp(left, halfW + 2, root.clientWidth – halfW – 2);
if (top – tip.offsetHeight 0) {
for (var v = yMin; v <= yMax + 1e-9; v += step) {
var gy = yAt(v);
svg.appendChild(el("line", {
"class": "ghchart__gridline", x1: M.left, y1: gy, x2: VB.w – M.right, y2: gy
}));
var yl = el("text", {
"class": "ghchart__axislabel ghchart__axislabel–y",
x: M.left – 18, y: gy, dy: "0.32em", "text-anchor": "end"
});
yl.textContent = fmt(v);
svg.appendChild(yl);
}
}
// Solid baseline.
svg.appendChild(el("line", {
"class": "ghchart__axisline", x1: M.left, y1: baseY, x2: VB.w – M.right, y2: baseY
}));
// x-axis labels.
for (var i = 0; i < nb; i++) {
var xl = el("text", {
"class": "ghchart__axislabel ghchart__axislabel–x",
x: xCenter(i), y: VB.h – M.bottom + 30, "text-anchor": "middle"
});
if (panel.xLabelSize) xl.setAttribute("style", "font-size:" + panel.xLabelSize + "px");
xl.textContent = labels[i];
svg.appendChild(xl);
}
// Bars (rounded top corners only) + full-height hover columns.
var panelBars = [];
for (var j = 0; j dark ramp is derived from a single tunable base color.
================================================================ */
renderers.heatmap = function (root, config) {
root.textContent = “”;
var WHITE = [255, 255, 255], BLACK = [0, 0, 0];
function hexToRgb(h) {
h = String(h).replace(“#”, “”);
if (h.length === 3) h = h[0] + h[0] + h[1] + h[1] + h[2] + h[2];
return [parseInt(h.slice(0, 2), 16), parseInt(h.slice(2, 4), 16), parseInt(h.slice(4, 6), 16)];
}
function rgbToHex(c) {
return “#” + c.map(function (x) {
x = Math.max(0, Math.min(255, Math.round(x)));
return (x level 4 dark) from one hex.
function rampFrom(baseHex) {
var b = hexToRgb(baseHex);
return [
rgbToHex(mix(b, WHITE, 0.80)),
rgbToHex(mix(b, WHITE, 0.52)),
rgbToHex(mix(b, WHITE, 0.20)),
baseHex,
rgbToHex(mix(b, BLACK, 0.30))
];
}
function trim0(s) { return s.replace(/.0$/, “”); }
function fmtM(v) {
if (v >= 1000) { var g = v / 1000; return (g >= 10 ? Math.round(g) : trim0(g.toFixed(1))) + “B”; }
if (v >= 1) return trim0(v.toFixed(1)) + “M”;
return Math.round(v * 1000) + “K”;
}
var MON = [“Jan”, “Feb”, “Mar”, “Apr”, “May”, “Jun”, “Jul”, “Aug”, “Sep”, “Oct”, “Nov”, “Dec”];
var MON_FULL = [“January”, “February”, “March”, “April”, “May”, “June”,
“July”, “August”, “September”, “October”, “November”, “December”];
var WD = [“Sun”, “Mon”, “Tue”, “Wed”, “Thu”, “Fri”, “Sat”];
var year = config.year || 2026;
var startM = config.startMonth != null ? config.startMonth : 0;
var endM = config.endMonth != null ? config.endMonth : 5;
var emptyColor = config.emptyColor || “#ebedf0”;
function daysInMonth(y, m) { return new Date(y, m + 1, 0).getDate(); }
function parseISO(s) { var p = s.split(“-“); return new Date(+p[0], +p[1] – 1, +p[2]); }
function dayStart(dt) { return new Date(dt.getFullYear(), dt.getMonth(), dt.getDate()); }
/* —- Eyebrow + title + subtitle —————————– */
if (config.eyebrow) {
var eb = html(“div”, “ghheat__eyebrow”);
eb.appendChild(html(“span”, “ghheat__eyedot”));
var ebt = html(“span”, “ghheat__eyetext”);
ebt.textContent = config.eyebrow;
eb.appendChild(ebt);
root.appendChild(eb);
}
var title = html(“span”, “ghchart__title”);
title.textContent = config.title;
root.appendChild(title);
if (config.subtitle) {
var sub = html(“p”, “ghchart__subtitle ghheat__subtitle”);
sub.innerHTML = config.subtitle;
root.appendChild(sub);
}
/* —- One shared tooltip ————————————– */
var tip = html(“div”, “ghchart__tooltip”);
tip.setAttribute(“role”, “status”);
var tipTitle = html(“div”, “ghchart__tt-title”);
var tipBody = html(“div”, “ghchart__tt-body”);
tip.appendChild(tipTitle);
tip.appendChild(tipBody);
root.appendChild(tip);
var motionMQ = window.matchMedia ? window.matchMedia(“(prefers-reduced-motion: reduce)”) : null;
function reduceMotion() { return !!(motionMQ && motionMQ.matches); }
var activeCell = null;
function hideTip() { activeCell = null; tip.setAttribute(“data-visible”, “false”); }
function showTip(rectEl, titleText, lines) {
var reappearing = activeCell === null;
activeCell = rectEl;
tipTitle.textContent = titleText;
tipBody.textContent = “”;
lines.forEach(function (ln) {
var r = html(“div”, “ghchart__tt-line”);
r.innerHTML = ln;
tipBody.appendChild(r);
});
var a = rectEl.getBoundingClientRect(), rr = root.getBoundingClientRect();
var left = a.left + a.width / 2 – rr.left, top = a.top – rr.top – 12;
var suppress = reappearing && !reduceMotion();
if (suppress) tip.style.transition = “opacity 0.12s ease”;
tip.setAttribute(“data-visible”, “true”);
var halfW = tip.offsetWidth / 2;
left = clamp(left, halfW + 2, root.clientWidth – halfW – 2);
if (top – tip.offsetHeight < 0) {
top = a.bottom – rr.top + 12;
tip.style.transform = "translate(-50%, 0)";
} else {
tip.style.transform = "translate(-50%, -100%)";
}
tip.style.left = left + "px";
tip.style.top = top + "px";
if (suppress) { void tip.offsetWidth; tip.style.transition = ""; }
}
/* —- Panels ————————————————– */
(config.panels || []).forEach(function (panel, pi) {
var base = (config.series && config.series[pi] && config.series[pi].color) || panel.base || "#3094ff";
var ramp = rampFrom(base);
var strong = ramp[4];
var totals = panel.months || [];
var activeVals = [];
for (var mi = startM; mi <= endM; mi++) { if (totals[mi] != null) activeVals.push(totals[mi]); }
var vmin = activeVals.length ? Math.min.apply(null, activeVals) : 0;
var vmax = activeVals.length ? Math.max.apply(null, activeVals) : 1;
function levelFor(t) {
if (t == null) return -1;
if (vmax === vmin) return 4;
return Math.round((t – vmin) / (vmax – vmin) * 4);
}
var af = panel.activeFrom ? parseISO(panel.activeFrom) : new Date(year, startM, 1);
var at = panel.activeTo ? parseISO(panel.activeTo) : new Date(year, endM, daysInMonth(year, endM));
var wrap = html("div", "ghheat__panel");
var head = html("div", "ghheat__phead");
var badge = html("span", "ghheat__badge");
badge.textContent = panel.badge != null ? panel.badge : (pi + 1);
badge.style.background = strong;
head.appendChild(badge);
var pt = html("span", "ghheat__ptitle");
pt.textContent = panel.title;
head.appendChild(pt);
if (panel.descriptor) {
var pd = html("span", "ghheat__pdesc");
pd.textContent = panel.descriptor;
head.appendChild(pd);
}
wrap.appendChild(head);
var body = html("div", "ghheat__body");
/* —- Calendar grid (SVG) —- */
var gridStart = new Date(year, startM, 1);
var gs = new Date(gridStart);
gs.setDate(gs.getDate() – gs.getDay()); // back to Sunday
var gridEnd = new Date(year, endM, daysInMonth(year, endM));
var ge = new Date(gridEnd);
ge.setDate(ge.getDate() + (6 – ge.getDay())); // forward to Saturday
var nCols = Math.round((ge – gs) / (7 * 86400000)) + 1;
var cell = 13, sq = 11, rad = 2.5, labL = 34, labT = 18;
var W = labL + nCols * cell, H = labT + 7 * cell;
var svg = el("svg", {
"class": "ghheat__grid",
viewBox: "0 0 " + W + " " + H,
preserveAspectRatio: "xMinYMin meet",
role: "img",
"aria-label": panel.title + " calendar heatmap"
});
[1, 3, 5].forEach(function (r) {
var t = el("text", {
"class": "ghheat__wd", x: labL – 6, y: labT + r * cell + sq / 2,
dy: "0.32em", "text-anchor": "end"
});
t.textContent = WD[r];
svg.appendChild(t);
});
// Month labels above the column where each month begins.
for (var lm = startM; lm <= endM; lm++) {
var first = new Date(year, lm, 1);
var colOf = Math.floor((dayStart(first) – gs) / (7 * 86400000));
var mlab = el("text", { "class": "ghheat__month", x: labL + colOf * cell, y: 12, "text-anchor": "start" });
mlab.textContent = MON[lm];
svg.appendChild(mlab);
}
var afS = dayStart(af), atS = dayStart(at);
var d = new Date(gs);
for (var i = 0; i = startM && m = afS && ds = 0 ? ramp[lvl] : emptyColor
});
if (inRange) {
(function (dt, mm, has) {
var dateStr = WD[dt.getDay()] + ” u00b7 ” + MON[mm] + ” ” + dt.getDate() + “, ” + year;
var lines;
if (has) {
var daily = totals[mm] / daysInMonth(year, mm);
lines = [
“” + fmtM(daily) + “ ” + panel.legendLabel,
MON_FULL[mm] + ” u00b7 ” + fmtM(totals[mm]) + ” ” + panel.unitTotal
];
} else {
lines = [panel.emptyNote || “No vetted data”];
}
cellEl.addEventListener(“pointermove”, function () { showTip(cellEl, dateStr, lines); });
cellEl.addEventListener(“pointerdown”, function () { showTip(cellEl, dateStr, lines); });
cellEl.addEventListener(“pointerleave”, hideTip);
})(new Date(d), m, hasData);
} else {
cellEl.setAttribute(“class”, “ghheat__cell ghheat__cell–pad”);
}
svg.appendChild(cellEl);
d.setDate(d.getDate() + 1);
}
var gridwrap = html(“div”, “ghheat__gridwrap”);
gridwrap.appendChild(svg);
body.appendChild(gridwrap);
/* —- Side column: stat + note + legend + extra —- */
var side = html(“div”, “ghheat__side”);
if (panel.stat) {
var stat = html(“div”, “ghheat__stat”);
var big = html(“span”, “ghheat__statbig”);
big.textContent = panel.stat.big;
big.style.color = strong;
stat.appendChild(big);
if (panel.stat.small) {
var small = html(“span”, “ghheat__statsmall”);
small.textContent = panel.stat.small;
stat.appendChild(small);
}
side.appendChild(stat);
}
if (panel.note) {
var note = html(“p”, “ghheat__note”);
note.innerHTML = panel.note;
side.appendChild(note);
}
var leg = html(“div”, “ghheat__legend”);
var lw1 = html(“span”, “ghheat__legword”); lw1.textContent = “Fewer”; leg.appendChild(lw1);
ramp.forEach(function (c) {
var s = html(“span”, “ghheat__sw”); s.style.background = c; leg.appendChild(s);
});
var lw2 = html(“span”, “ghheat__legword”); lw2.textContent = “More”; leg.appendChild(lw2);
if (panel.legendLabel) {
var lu = html(“span”, “ghheat__legunit”); lu.textContent = “u00b7 ” + panel.legendLabel; leg.appendChild(lu);
}
side.appendChild(leg);
if (panel.extraNote) {
var ex = html(“div”, “ghheat__extra”);
var exsw = html(“span”, “ghheat__sw ghheat__sw–empty”);
exsw.style.background = emptyColor;
ex.appendChild(exsw);
var ext = html(“span”, “ghheat__extratext”);
ext.innerHTML = panel.extraNote;
ex.appendChild(ext);
side.appendChild(ex);
}
body.appendChild(side);
wrap.appendChild(body);
root.appendChild(wrap);
});
if (config.caption) {
var cap = html(“div”, “ghchart__caption”);
cap.innerHTML = config.caption;
root.appendChild(cap);
}
};
/* ================================================================
Scatter renderer — X/Y numeric plot with categorical points.
Used for cost-vs-quality benchmark charts: a highlighted “primary”
point (glow halo), a “reference” point with a dotted crosshair, and
muted “other” points. Values never print on the marks — a point’s
name shows for identity and the exact (y, x) reveals on hover.
================================================================ */
renderers.scatter = function (root, config) {
root.textContent = “”;
var uid = config.mountId;
var VB = { w: 1000, h: 600 };
var M = { top: 40, right: 30, bottom: 74, left: 96 };
var innerW = VB.w – M.left – M.right;
var innerH = VB.h – M.top – M.bottom;
var xa = config.xAxis, ya = config.yAxis;
var fmtX = xa.format || function (v) { return String(v); };
var fmtY = ya.format || function (v) { return String(v); };
var tipSuffix = config.tipSuffix || “”;
function xAt(v) { return M.left + innerW * (v – xa.min) / (xa.max – xa.min); }
function yAt(v) { return M.top + innerH * (1 – (v – ya.min) / (ya.max – ya.min)); }
var baseY = yAt(ya.min);
var motionMQ = window.matchMedia
? window.matchMedia(“(prefers-reduced-motion: reduce)”)
: null;
function reduceMotion() { return !!(motionMQ && motionMQ.matches); }
function colorOf(pt) {
var s = config.series && config.series[pt.series || 0];
return (s && s.color) || “#8c959f”;
}
/* —- Title (compact narrative headline, no rule) ———— */
var title = html(“div”, “ghchart__headline”);
title.textContent = config.title;
root.appendChild(title);
/* —- Header + legend (from series) ————————– */
if (!config.hideLegend) {
var header = html(“div”, “ghchart__header”);
var legend = html(“div”, “ghchart__legend”);
(config.series || []).forEach(function (s) {
var item = html(“span”, “ghchart__legend-item”);
var sw = html(“span”, “ghchart__swatch ghchart__swatch–dot”);
sw.style.background = s.color;
item.appendChild(sw);
item.appendChild(document.createTextNode(s.name));
legend.appendChild(item);
});
header.appendChild(legend);
root.appendChild(header);
}
/* —- SVG plot ———————————————– */
var svg = el(“svg”, {
“class”: “ghchart__plot ghchart__plot–scatter”,
viewBox: “0 0 ” + VB.w + ” ” + VB.h,
preserveAspectRatio: “xMidYMid meet”,
role: “img”,
“aria-label”: config.title + ” scatter plot”
});
// Gridlines (both directions) + tick labels.
var eps = 1e-6;
for (var yv = ya.min; yv <= ya.max + eps; yv += ya.step) {
var gy = yAt(yv);
svg.appendChild(el("line", {
"class": "ghchart__gridline",
x1: M.left, y1: gy, x2: VB.w – M.right, y2: gy
}));
var yl = el("text", {
"class": "ghchart__axislabel ghchart__axislabel–y",
x: M.left – 16, y: gy, dy: "0.32em", "text-anchor": "end"
});
yl.textContent = fmtY(yv);
svg.appendChild(yl);
}
for (var xv = xa.min; xv <= xa.max + eps; xv += xa.step) {
var gx = xAt(xv);
svg.appendChild(el("line", {
"class": "ghchart__gridline ghchart__gridline–v",
x1: gx, y1: M.top, x2: gx, y2: baseY
}));
var isFirst = Math.abs(xv – xa.min) < eps;
var isLast = Math.abs(xv – xa.max) < eps;
var xl = el("text", {
"class": "ghchart__axislabel ghchart__axislabel–x",
x: gx, y: baseY + 34,
"text-anchor": isFirst ? "start" : (isLast ? "end" : "middle")
});
xl.textContent = fmtX(xv);
svg.appendChild(xl);
}
// Axis titles.
if (xa.title) {
var xt = el("text", {
"class": "ghchart__axistitle",
x: M.left + innerW / 2, y: VB.h – 12, "text-anchor": "middle"
});
xt.textContent = xa.title;
svg.appendChild(xt);
}
if (ya.title) {
var ytX = 24, ytY = M.top + innerH / 2;
var yt = el("text", {
"class": "ghchart__axistitle",
x: ytX, y: ytY, "text-anchor": "middle",
transform: "rotate(-90 " + ytX + " " + ytY + ")"
});
yt.textContent = ya.title;
svg.appendChild(yt);
}
// Reference crosshair through the flagged point (dual dotted lines).
var refPt = (config.points || []).filter(function (p) { return p.reference; })[0];
if (refPt) {
var rColor = colorOf(refPt);
var rx = xAt(refPt.x), ry = yAt(refPt.y);
svg.appendChild(el("line", {
"class": "ghchart__crosshair",
x1: rx, y1: M.top, x2: rx, y2: baseY, stroke: rColor
}));
svg.appendChild(el("line", {
"class": "ghchart__crosshair",
x1: M.left, y1: ry, x2: VB.w – M.right, y2: ry, stroke: rColor
}));
}
// Points: halo (highlight/reference) + dot + name label.
var dotEls = [], hitEls = [];
(config.points || []).forEach(function (pt, i) {
var cx = xAt(pt.x), cy = yAt(pt.y), c = colorOf(pt);
var big = pt.highlight || pt.reference;
if (big) {
svg.appendChild(el("circle", {
"class": "ghchart__halo", cx: cx, cy: cy, r: 17, fill: c
}));
}
var dot = el("circle", {
"class": "ghchart__pt", cx: cx, cy: cy,
r: big ? 9 : 5.5, fill: c
});
svg.appendChild(dot);
dotEls.push({ el: dot, baseR: big ? 9 : 5.5 });
// Name label — bold+colored for the story points, muted for the rest.
var pos = pt.labelPos || (pt.highlight ? "below" : pt.reference ? "above" : "right");
var dx = 0, dy = 0, anchor = "middle";
var gap = big ? 15 : 9;
if (pos === "right") { dx = gap + 4; dy = 5; anchor = "start"; }
else if (pos === "left") { dx = -(gap + 4); dy = 5; anchor = "end"; }
else if (pos === "above") { dy = -(gap + 6); anchor = "middle"; }
else { dy = gap + 16; anchor = "middle"; } // below
var lbl = el("text", {
"class": "ghchart__pt-label" + (big ? " ghchart__pt-label–strong" : ""),
x: cx + dx, y: cy + dy, "text-anchor": anchor,
fill: big ? c : null
});
lbl.textContent = pt.label;
svg.appendChild(lbl);
// Transparent hit target for hover/focus.
var hit = el("circle", {
"class": "ghchart__pthit", cx: cx, cy: cy, r: 20,
tabindex: "0", role: "img",
"aria-label": pt.label + ": " + fmtY(pt.y) + ", " + fmtX(pt.x) + tipSuffix
});
svg.appendChild(hit);
hitEls.push(hit);
});
root.appendChild(svg);
/* —- Tooltip (title + free lines) ————————— */
var tip = html("div", "ghchart__tooltip");
tip.setAttribute("role", "status");
var tipTitle = html("div", "ghchart__tt-title");
var tipBody = html("div", "ghchart__tt-body");
tip.appendChild(tipTitle);
tip.appendChild(tipBody);
root.appendChild(tip);
var activeIndex = -1;
function show(i) {
var pt = config.points[i];
if (!pt) return;
var reappearing = activeIndex === -1;
activeIndex = i;
dotEls.forEach(function (d, di) {
d.el.setAttribute("r", di === i ? d.baseR + 2.5 : d.baseR);
});
tipTitle.textContent = pt.label;
tipBody.textContent = "";
var line = html("div", "ghchart__tt-line");
line.textContent = fmtY(pt.y) + " · " + fmtX(pt.x) + tipSuffix;
tipBody.appendChild(line);
var anchor = dotEls[i].el.getBoundingClientRect();
var rootRect = root.getBoundingClientRect();
var left = anchor.left + anchor.width / 2 – rootRect.left;
var top = anchor.top – rootRect.top – 12;
var suppress = reappearing && !reduceMotion();
if (suppress) tip.style.transition = "opacity 0.12s ease";
tip.setAttribute("data-visible", "true");
var halfW = tip.offsetWidth / 2;
left = clamp(left, halfW + 2, root.clientWidth – halfW – 2);
if (top – tip.offsetHeight 0) {
svg.appendChild(el(“line”, {
“class”: “ghchart__phase-sep”, x1: x0, y1: M.top, x2: x0, y2: baseY
}));
}
var pl = el(“text”, {
“class”: “ghchart__phase-label”, x: (x0 + x1) / 2, y: M.top – 40,
“text-anchor”: “middle”
});
pl.textContent = ph.label;
svg.appendChild(pl);
if (ph.avg) {
var pa = el(“text”, {
“class”: “ghchart__phase-avg”, x: (x0 + x1) / 2, y: M.top + 24,
“text-anchor”: “middle”, fill: cPoint
});
pa.textContent = ph.avg;
svg.appendChild(pa);
}
});
// Horizontal gridlines + y tick labels (skip a gridline at the reference y).
var refY = config.reference ? config.reference.y : null;
(ya.ticks || []).forEach(function (tv) {
var gy = yAt(tv);
if (refY === null || Math.abs(tv – refY) > 1e-9) {
svg.appendChild(el(“line”, {
“class”: “ghchart__gridline”, x1: M.left, y1: gy, x2: VB.w – M.right, y2: gy
}));
}
var yl = el(“text”, {
“class”: “ghchart__axislabel ghchart__axislabel–y”,
x: M.left – 16, y: gy, dy: “0.32em”, “text-anchor”: “end”
});
yl.textContent = fmtY(tv);
svg.appendChild(yl);
});
// X tick labels (dated).
(xa.ticks || []).forEach(function (t) {
var gx = xAt(t.at);
var first = Math.abs(t.at – xa.min) < 1e-9, last = Math.abs(t.at – xa.max) < 1e-9;
var xl = el("text", {
"class": "ghchart__axislabel ghchart__axislabel–x",
x: gx, y: baseY + 30, "text-anchor": first ? "start" : (last ? "end" : "middle")
});
xl.textContent = t.text;
svg.appendChild(xl);
});
// Axis titles.
if (ya.title) {
var ytX = 22, ytY = M.top + innerH / 2;
var yt = el("text", {
"class": "ghchart__axistitle", x: ytX, y: ytY, "text-anchor": "middle",
transform: "rotate(-90 " + ytX + " " + ytY + ")"
});
yt.textContent = ya.title;
svg.appendChild(yt);
}
// Trend: optional ±band (linear only), then the dashed line + slope label.
var tr = config.trend;
if (tr) {
function trendY(x) {
return tr.from.y + (tr.to.y – tr.from.y) * (x – tr.from.x) / (tr.to.x – tr.from.x);
}
if (tr.band && !isLog) {
var p = tr.band;
var pts = [
[xAt(tr.from.x), yAt(trendY(tr.from.x) + p)],
[xAt(tr.to.x), yAt(trendY(tr.to.x) + p)],
[xAt(tr.to.x), yAt(trendY(tr.to.x) – p)],
[xAt(tr.from.x), yAt(trendY(tr.from.x) – p)]
].map(function (a) { return a[0] + "," + a[1]; }).join(" ");
svg.appendChild(el("polygon", {
"class": "ghchart__trendband", points: pts, fill: cTrend
}));
}
svg.appendChild(el("line", {
"class": "ghchart__trendline",
x1: xAt(tr.from.x), y1: yAt(tr.from.y),
x2: xAt(tr.to.x), y2: yAt(tr.to.y), stroke: cTrend
}));
if (tr.label) {
var lx, lyy;
if (tr.labelAt) { lx = xAt(tr.labelAt.x); lyy = yAt(tr.labelAt.y); }
else {
lx = xAt(tr.to.x) + (tr.labelDX == null ? -6 : tr.labelDX);
lyy = yAt(tr.to.y) + (tr.labelDY == null ? -12 : tr.labelDY);
}
var sl = el("text", {
"class": "ghchart__slope", x: lx, y: lyy,
"text-anchor": tr.labelAnchor || "end", fill: cTrend
});
sl.textContent = tr.label;
svg.appendChild(sl);
}
}
// Reference line (horizontal dashed) + right-aligned label.
if (config.reference) {
var rc = config.reference.color || "#24292f";
var ryy = yAt(config.reference.y);
svg.appendChild(el("line", {
"class": "ghchart__refline", x1: M.left, y1: ryy, x2: VB.w – M.right, y2: ryy,
stroke: rc
}));
if (config.reference.label) {
var rl = el("text", {
"class": "ghchart__reflabel", x: VB.w – M.right, y: ryy – 8,
"text-anchor": "end", fill: rc
});
rl.textContent = config.reference.label;
svg.appendChild(rl);
}
}
// Data squares (values reveal on hover only).
var side = 13, hSide = side / 2;
var sqEls = [], hitEls = [];
(config.points || []).forEach(function (pt, i) {
var cx = xAt(pt.x), cy = yAt(pt.y);
var sq = el("rect", {
"class": "ghchart__square", x: cx – hSide, y: cy – hSide,
width: side, height: side, rx: 2, fill: cPoint
});
svg.appendChild(sq);
sqEls.push({ el: sq, cx: cx, cy: cy });
// Hover/focus hit target — omitted when hover is disabled so the
// (illustrative) point values never surface, on screen or to a11y.
if (!config.disableHover) {
var hit = el("rect", {
"class": "ghchart__squarehit", x: cx – 13, y: cy – 13,
width: 26, height: 26, tabindex: "0", role: "img",
"aria-label": (pt.d || "") + " " + fmtY(pt.y)
});
svg.appendChild(hit);
hitEls.push(hit);
}
});
// Invalid-run markers: red diamond + X, leader line, annotation text.
(config.invalids || []).forEach(function (iv) {
var cx = xAt(iv.x), cy = yAt(iv.y);
svg.appendChild(el("rect", {
"class": "ghchart__invalid", x: cx – hSide, y: cy – hSide,
width: side, height: side, rx: 1.5, fill: "none", stroke: cInvalid,
transform: "rotate(45 " + cx + " " + cy + ")"
}));
var q = 3.4;
svg.appendChild(el("line", {
"class": "ghchart__invalid-x", x1: cx – q, y1: cy – q, x2: cx + q, y2: cy + q,
stroke: cInvalid
}));
svg.appendChild(el("line", {
"class": "ghchart__invalid-x", x1: cx – q, y1: cy + q, x2: cx + q, y2: cy – q,
stroke: cInvalid
}));
if (iv.title) {
var tx = cx + (iv.labelDX == null ? 16 : iv.labelDX);
var ty = cy + (iv.labelDY == null ? -26 : iv.labelDY);
svg.appendChild(el("line", {
"class": "ghchart__leader", x1: cx, y1: cy, x2: tx, y2: ty, stroke: cInvalid
}));
var anchor = iv.labelAnchor || "start";
var at = el("text", {
"class": "ghchart__anno-title", x: tx, y: ty – 4, "text-anchor": anchor, fill: cInvalid
});
at.textContent = iv.title;
svg.appendChild(at);
if (iv.sub) {
var asu = el("text", {
"class": "ghchart__anno-sub", x: tx, y: ty + 11, "text-anchor": anchor
});
asu.textContent = iv.sub;
svg.appendChild(asu);
}
}
});
// Bracket annotation (span with end ticks + centered label above).
(config.brackets || []).forEach(function (b) {
var x0 = xAt(b.fromX), x1 = xAt(b.toX), by = yAt(b.y);
svg.appendChild(el("line", {
"class": "ghchart__bracket", x1: x0, y1: by, x2: x1, y2: by
}));
svg.appendChild(el("line", { "class": "ghchart__bracket", x1: x0, y1: by, x2: x0, y2: by + 7 }));
svg.appendChild(el("line", { "class": "ghchart__bracket", x1: x1, y1: by, x2: x1, y2: by + 7 }));
var bl = el("text", {
"class": "ghchart__bracket-label", x: (x0 + x1) / 2, y: by – 8, "text-anchor": "middle"
});
bl.textContent = b.text;
svg.appendChild(bl);
});
// Final callout: ringed point + leader + title/sub placed inside the plot.
if (config.callout) {
var co = config.callout;
var ccx = xAt(co.x), ccy = yAt(co.y);
svg.appendChild(el("circle", {
"class": "ghchart__callout-ring", cx: ccx, cy: ccy, r: 12, stroke: cPoint
}));
var ctx = ccx + (co.labelDX == null ? -16 : co.labelDX);
var cty = ccy + (co.labelDY == null ? -30 : co.labelDY);
svg.appendChild(el("line", {
"class": "ghchart__leader ghchart__leader–callout", x1: ccx, y1: ccy, x2: ctx, y2: cty,
stroke: cPoint
}));
var can = co.labelAnchor || "end";
var ct = el("text", {
"class": "ghchart__anno-title ghchart__anno-title–callout", x: ctx, y: cty – 4, "text-anchor": can, fill: cPoint
});
ct.textContent = co.title;
svg.appendChild(ct);
if (co.sub) {
var cs = el("text", {
"class": "ghchart__anno-sub ghchart__anno-sub–callout", x: ctx, y: cty + 12, "text-anchor": can
});
cs.textContent = co.sub;
svg.appendChild(cs);
}
}
root.appendChild(svg);
if (config.caption) {
var cap = html("div", "ghchart__caption");
cap.textContent = config.caption;
root.appendChild(cap);
}
/* —- Tooltip + hover interaction (skipped when disabled) —— */
if (!config.disableHover) {
var tip = html("div", "ghchart__tooltip");
tip.setAttribute("role", "status");
var tipTitle = html("div", "ghchart__tt-title");
var tipBody = html("div", "ghchart__tt-body");
tip.appendChild(tipTitle);
tip.appendChild(tipBody);
root.appendChild(tip);
var activeIndex = -1;
function show(i) {
var pt = config.points[i];
if (!pt) return;
var reappearing = activeIndex === -1;
activeIndex = i;
sqEls.forEach(function (s, si) {
var big = si === i;
var w = big ? side + 5 : side;
s.el.setAttribute("width", w);
s.el.setAttribute("height", w);
s.el.setAttribute("x", s.cx – w / 2);
s.el.setAttribute("y", s.cy – w / 2);
});
var tipInfo = config.pointTip
? config.pointTip(pt)
: { title: pt.d || "", line: fmtY(pt.y) };
tipTitle.textContent = tipInfo.title;
tipBody.textContent = "";
var line = html("div", "ghchart__tt-line");
line.textContent = tipInfo.line;
tipBody.appendChild(line);
var anchor = sqEls[i].el.getBoundingClientRect();
var rootRect = root.getBoundingClientRect();
var left = anchor.left + anchor.width / 2 – rootRect.left;
var top = anchor.top – rootRect.top – 12;
var suppress = reappearing && !reduceMotion();
if (suppress) tip.style.transition = "opacity 0.12s ease";
tip.setAttribute("data-visible", "true");
var halfW = tip.offsetWidth / 2;
left = clamp(left, halfW + 2, root.clientWidth – halfW – 2);
if (top – tip.offsetHeight < 0) {
top = anchor.bottom – rootRect.top + 12;
tip.style.transform = "translate(-50%, 0)";
} else {
tip.style.transform = "translate(-50%, -100%)";
}
tip.style.left = left + "px";
tip.style.top = top + "px";
if (suppress) { void tip.offsetWidth; tip.style.transition = ""; }
}
function hide() {
activeIndex = -1;
tip.setAttribute("data-visible", "false");
sqEls.forEach(function (s) {
s.el.setAttribute("width", side);
s.el.setAttribute("height", side);
s.el.setAttribute("x", s.cx – hSide);
s.el.setAttribute("y", s.cy – hSide);
});
}
hitEls.forEach(function (hit, i) {
hit.addEventListener("pointerenter", function () { show(i); });
hit.addEventListener("pointermove", function () { show(i); });
hit.addEventListener("pointerleave", hide);
hit.addEventListener("focus", function () { show(i); });
hit.addEventListener("blur", hide);
});
}
};
/* ================================================================
Distribution dashboard renderer
—————————————————————-
A composition figure (no hover — every value is printed as text, so
the marks are inherently screen-reader accessible):
• a compact narrative headline + muted subtitle;
• an optional segmented "mix" bar — proportional colored segments,
each with its name inside and count/percent below;
• one or more panels of ranked horizontal bars, each row printing
its category (left), a bar, and its count/percent (right).
Colors come from config.series so the harness can tune them live:
series[0] = bar fill (single base hex);
series[1..] = segment fills, in the order of config.segments.items.
================================================================ */
renderers.distribution = function (root, config) {
root.textContent = "";
root.setAttribute("role", "img");
if (config.title) root.setAttribute("aria-label", config.title);
var series = config.series || [];
var barColor = (series[0] && series[0].color) || "#8250df";
var total = config.total ||
(config.segments && config.segments.items
? config.segments.items.reduce(function (a, b) { return a + b.value; }, 0)
: 0);
function pctText(v) {
if (!total) return "";
return (Math.round((v / total) * 1000) / 10).toFixed(1) + "%";
}
function valueHTML(v) {
var p = pctText(v);
return "” + v + “” + (p ? ” (” + p + “)” : “”);
}
/* —- Headline + subtitle ————————————- */
if (config.title) {
var head = html(“div”, “ghchart__headline”);
head.textContent = config.title;
root.appendChild(head);
}
if (config.subtitle) {
var sub = html(“p”, “ghchart__subtitle”);
sub.textContent = config.subtitle;
root.appendChild(sub);
}
/* —- Segmented “mix” bar ————————————– */
var seg = config.segments;
if (seg && seg.items && seg.items.length) {
var segSec = html(“div”, “ghchart__dist-section”);
if (seg.title) {
var segTitle = html(“div”, “ghchart__panel-title”);
segTitle.textContent = seg.title;
segSec.appendChild(segTitle);
}
var segTotal = seg.items.reduce(function (a, b) { return a + b.value; }, 0) || 1;
var bar = html(“div”, “ghchart__seg”);
var notes = html(“div”, “ghchart__seg-note-row”);
seg.items.forEach(function (it, i) {
var basis = (it.value / segTotal) * 100;
var col = (series[i + 1] && series[i + 1].color) || it.color || barColor;
var cell = html(“div”, “ghchart__seg-cell”);
cell.style.flex = “0 0 ” + basis + “%”;
cell.style.background = col;
cell.textContent = it.label;
bar.appendChild(cell);
var note = html(“div”, “ghchart__seg-note”);
note.style.flex = “0 0 ” + basis + “%”;
note.innerHTML = valueHTML(it.value);
notes.appendChild(note);
});
segSec.appendChild(bar);
segSec.appendChild(notes);
root.appendChild(segSec);
}
/* —- Ranked bar panels (grid: 2-up, stacking on narrow) —— */
var panels = config.panels || [];
if (panels.length) {
var cols = html(“div”, “ghchart__dist-cols”);
if (config.columns === 1 || panels.length === 1) {
cols.classList.add(“ghchart__dist-cols–stack”);
}
panels.forEach(function (panel) {
var sec = html(“div”, “ghchart__dist-section”);
if (panel.title) {
var pt = html(“div”, “ghchart__panel-title”);
pt.textContent = panel.title;
sec.appendChild(pt);
}
var list = html(“div”, “ghchart__dist-list”);
var pmax = (panel.items || []).reduce(function (m, it) {
return it.value > m ? it.value : m;
}, 0) || 1;
(panel.items || []).forEach(function (it) {
var row = html(“div”, “ghchart__dist-row”);
var cat = html(“div”, “ghchart__dist-cat”);
cat.textContent = it.label;
row.appendChild(cat);
var track = html(“div”, “ghchart__dist-track”);
var b = html(“div”, “ghchart__dist-bar”);
b.style.width = Math.max((it.value / pmax) * 100, 1.2) + “%”;
b.style.background = it.color || barColor;
track.appendChild(b);
row.appendChild(track);
var val = html(“div”, “ghchart__dist-val”);
val.innerHTML = valueHTML(it.value);
row.appendChild(val);
list.appendChild(row);
});
sec.appendChild(list);
cols.appendChild(sec);
});
root.appendChild(cols);
}
/* —- Caption / footnote ————————————– */
if (config.caption) {
var cap = html(“div”, “ghchart__caption”);
cap.innerHTML = config.caption;
root.appendChild(cap);
}
};
/* ================================================================
Dispatcher — pick a renderer by config.type and draw into a mount
================================================================ */
function render(config, mountEl) {
var root = mountEl || document.getElementById(config.mountId);
if (!root) return;
root.classList.add(“ghchart”);
/* Resolve the renderer from the SHARED registry (see registration below),
not this bundle’s private `renderers`. When several exported charts share
one page they all merge into one registry, so every chart finds its
renderer even if an older engine bundle loaded first. */
var reg = (global.GHChartEngine && global.GHChartEngine.renderers) || renderers;
var fn = reg[config.type] || renderers[config.type] || reg.line || renderers.line;
fn(root, config);
}
/* —————————————————————-
Shared-engine registration (multi-embed safe)
—————————————————————-
Every exported chart.js embeds this whole engine. When two or more
charts are placed on the same page (e.g. a WordPress post), we must NOT
let the first-loaded bundle silently win — an older bundle would be
missing renderers added later (this is why a heatmap pasted after an
older bar chart used to vanish).
Instead we keep ONE shared engine:
• every bundle merges in any renderers the shared registry lacks;
• the newest bundle (highest ENGINE_VERSION) provides render(), which
reads renderers from the shared registry at call time.
The result is order-independent and resilient to version skew as new
chart types are added. Bump ENGINE_VERSION whenever renderers or render
change so a newer embed upgrades an older shared engine in place. */
var ENGINE_VERSION = 9;
var existing = global.GHChartEngine;
if (existing && typeof existing.version === “number”) {
if (ENGINE_VERSION > existing.version) {
/* This bundle is newer. Every export embeds the COMPLETE engine, so this
bundle’s `renderers` is a self-contained, up-to-date set. Adopt it as
the shared registry (upgrading older same-named renderers in place),
while defensively preserving any renderer types only the older engine
happened to have. Then take over render(). */
for (var ek in existing.renderers) {
if (Object.prototype.hasOwnProperty.call(existing.renderers, ek) && !renderers[ek]) {
renderers[ek] = existing.renderers[ek];
}
}
existing.renderers = renderers;
existing.render = render;
existing.version = ENGINE_VERSION;
} else {
/* Same or older version already present: only contribute renderer types
the shared registry is missing (don’t clobber an equal/newer engine). */
for (var rk in renderers) {
if (Object.prototype.hasOwnProperty.call(renderers, rk) && !existing.renderers[rk]) {
existing.renderers[rk] = renderers[rk];
}
}
}
} else {
/* No engine yet, or a pre-versioning (old-style) engine loaded first.
Take over, preserving any renderers the old-style engine registered. */
if (existing && existing.renderers) {
for (var ok in existing.renderers) {
if (Object.prototype.hasOwnProperty.call(existing.renderers, ok) && !renderers[ok]) {
renderers[ok] = existing.renderers[ok];
}
}
}
global.GHChartEngine = { renderers: renderers, render: render, version: ENGINE_VERSION };
}
})(typeof window !== “undefined” ? window : this);
;(function () {
“use strict”;
var CONFIG = {
mountId: “gh-chart-hf-checkpoint”,
type: “scatter”,
title: “HydraFusion – Checkpoint Bench – GitHub Copilot CLI”,
xAxis: {
min: 0,
max: 25,
step: 5,
title: “Mean cost per task (USD)”,
format: function (v) { return “$” + v.toFixed(2); }
},
yAxis: {
min: 74,
max: 79,
step: 1,
title: “Mean session score”,
format: function (v) { return v + “%”; }
},
tipSuffix: “/task”,
series: [
{
name: “HydraFusion”,
color: “#2da44f”
},
{
name: “Opus 5 (reference)”,
color: “#8250df”
},
{
name: “Other solo models”,
color: “#8c959f”
}
],
points: [
{
label: “HydraFusion”,
x: 8.5,
y: 77.5,
series: 0,
highlight: true,
labelPos: “below”
},
{
label: “Opus 5”,
x: 24.1,
y: 77.6,
series: 1,
reference: true,
labelPos: “above”
},
{
label: “GPT-5.6-Sol”,
x: 7.5,
y: 76.1,
series: 2,
labelPos: “right”
},
{
label: “Sonnet 5”,
x: 5.3,
y: 75.85,
series: 2,
labelPos: “right”
},
{
label: “GPT-5.6-Terra”,
x: 2,
y: 75.3,
series: 2,
labelPos: “right”
},
{
label: “GPT-5.6-Luna”,
x: 0.3,
y: 74.35,
series: 2,
labelPos: “right”
}
]
};
function boot() {
var root = document.getElementById(CONFIG.mountId);
if (!root || root.getAttribute(“data-gh-rendered”)) return;
root.setAttribute(“data-gh-rendered”, “1”);
window.GHChartEngine.render(CONFIG);
}
if (document.readyState === “loading”) {
document.addEventListener(“DOMContentLoaded”, boot);
} else {
boot();
}
})();
Early internal testing has echoed that result.
So far, the reasoning and task solving capability [of HydraFusion] is at or better than Opus.
Principal Software Engineer at Microsoft
Hill-climbing HydraFusion
HydraFusion’s routing policies were shaped by how developers use GitHub Copilot on real coding tasks. To make those workflows reproducible, we curated CheckpointBench from real Copilot coding-session trajectories. We refined HydraFusion repeatedly across CheckpointBench, DeepSWE, and TerminalBench 2.1, optimizing across the evaluation sets rather than for any single benchmark.
HydraFusion’s per-capability scores provided a consistent basis for comparing candidate routing policies. Instead of manually tuning thresholds, we used beam search to build the optimal decision policy. Each candidate was measured against a frozen baseline on quality, cost, and failure modes, so improvements were evaluated on stable ground.
TerminalBench 2.1 provides the most complete sequence of runs, making it the clearest view of this iterative improvement. The progression was not linear. Between August 11 and August 25, two operational failures in the evaluation harness produced invalid runs. Those failures were excluded from the performance trend, corrected, and followed by continued gains in the HydraFusion configurations. By August 25, HydraFusion had reached its strongest operating points in the recorded series.
.ghchart {
/* Theme tokens */
–ghc-text: #1f2328;
–ghc-muted: #656d76;
–ghc-grid: #d0d7de;
–ghc-axis: #59636e;
–ghc-card-bg: #ffffff;
–ghc-card-border: #d0d7de;
–ghc-divider: #b6bfb8;
–ghc-guide: #afb8c1;
/* GitHub brand font — matches the github.blog stack (Mona Sans, with
the blog’s metric fallback) so it renders identically in-context. */
font-family: “Mona Sans”, “Mona Sans Fallback”, -apple-system, “system-ui”,
“Segoe UI”, Helvetica, Arial, sans-serif;
-webkit-font-smoothing: antialiased;
text-rendering: optimizeLegibility;
position: relative;
box-sizing: border-box;
width: 100%;
max-width: 699px;
margin: 0 auto;
color: var(–ghc-text);
line-height: 1.4;
}
.ghchart *,
.ghchart *::before,
.ghchart *::after { box-sizing: border-box; }
/* —————————————————————— */
/* Header + legend */
/* —————————————————————— */
.ghchart__header {
display: flex;
justify-content: flex-end;
align-items: center;
min-height: 24px;
margin-bottom: 4px;
}
.ghchart__legend {
display: flex;
align-items: center;
gap: 20px;
flex-wrap: wrap;
justify-content: flex-end;
}
.ghchart__legend-item {
display: inline-flex;
align-items: center;
gap: 8px;
font-size: clamp(14px, 1.9vw, 17px);
font-weight: 600;
color: var(–ghc-muted);
white-space: nowrap;
}
.ghchart__swatch {
width: 14px;
height: 14px;
border-radius: 4px;
flex: 0 0 auto;
}
/* —————————————————————— */
/* Plot (SVG) */
/* —————————————————————— */
.ghchart__plot {
display: block;
width: 100%;
height: auto;
overflow: visible;
touch-action: pan-y;
}
.ghchart__gridline {
stroke: var(–ghc-grid);
stroke-width: 1;
stroke-dasharray: 2 6;
stroke-linecap: round;
opacity: 0.9;
}
.ghchart__axislabel {
fill: var(–ghc-axis);
font-size: 22px;
font-weight: 500;
}
.ghchart__axislabel–x { font-weight: 600; }
.ghchart__line {
fill: none;
stroke-linecap: round;
stroke-linejoin: round;
}
.ghchart__dot { transition: r 0.12s ease; }
/* Dashed threshold line (e.g. a target/reference level) + floating label.
Stroke color is set inline per chart; dash + label styling live here. */
.ghchart__threshold {
stroke-width: 2;
stroke-dasharray: 7 6;
stroke-linecap: round;
opacity: 0.9;
}
.ghchart__threshold-label {
font-size: 20px;
font-weight: 700;
letter-spacing: -0.01em;
}
/* Hatched band marking a partial / projected trailing region. */
.ghchart__projection { pointer-events: none; }
.ghchart__guide {
stroke: var(–ghc-guide);
stroke-width: 1.5;
stroke-dasharray: 4 4;
opacity: 0;
transition: opacity 0.12s ease;
}
.ghchart__hit { fill: transparent; }
/* —————————————————————— */
/* Scatter plot */
/* —————————————————————— */
.ghchart__gridline–v { /* vertical gridlines reuse the dashed grid style */ }
.ghchart__axistitle {
fill: var(–ghc-muted);
font-size: 20px;
font-weight: 600;
letter-spacing: -0.01em;
}
/* Dotted reference crosshair through the “reference” point. Stroke color
is set inline (tracks the reference series color). */
.ghchart__crosshair {
stroke-width: 2;
stroke-dasharray: 2 7;
stroke-linecap: round;
opacity: 0.85;
pointer-events: none;
}
.ghchart__halo { opacity: 0.18; pointer-events: none; }
.ghchart__pt { transition: r 0.12s ease; }
.ghchart__pt-label {
fill: var(–ghc-muted);
font-size: 19px;
font-weight: 600;
letter-spacing: -0.01em;
pointer-events: none;
}
.ghchart__pt-label–strong { font-size: 21px; font-weight: 700; }
.ghchart__pthit { fill: transparent; cursor: default; outline: none; }
.ghchart__pthit:focus-visible {
outline: 2px solid var(–ghc-axis);
outline-offset: 1px;
}
.ghchart__swatch–dot { border-radius: 50%; }
/* —————————————————————— */
/* Trend chart (dated time-series with narrative headline) */
/* —————————————————————— */
.ghchart__headline {
font-size: clamp(17px, 2.3vw, 20px);
line-height: 1.32;
font-weight: 700;
letter-spacing: -0.01em;
color: var(–ghc-text);
margin: 0 0 8px;
}
/* Trend legend sits left-aligned under the headline/subtitle. */
.ghchart__legend–trend {
justify-content: flex-start;
margin: 2px 0 14px;
}
.ghchart__glyph { flex: 0 0 auto; }
.ghchart__glyph–square {
width: 13px; height: 13px; border-radius: 2px;
}
.ghchart__glyph–diamond {
width: 12px; height: 12px; border: 1.5px solid; transform: rotate(45deg);
}
.ghchart__glyph–line {
width: 20px; height: 0; border-top: 2px dashed; border-radius: 0;
}
/* Phase background columns + separators + top labels. */
.ghchart__phase { fill: #f6f8fa; opacity: 0.55; }
.ghchart__phase–alt { fill: #ffffff; opacity: 0; }
.ghchart__phase-sep {
stroke: var(–ghc-grid); stroke-width: 1; stroke-dasharray: 2 5; opacity: 0.8;
}
.ghchart__phase-label {
fill: var(–ghc-muted);
font-size: 15px;
font-weight: 700;
letter-spacing: 0.06em;
}
.ghchart__phase-avg {
font-size: 16px;
font-weight: 700;
letter-spacing: -0.01em;
}
/* Dashed trend line + ± noise band + slope label. */
.ghchart__trendband { opacity: 0.12; pointer-events: none; }
.ghchart__trendline {
stroke-width: 2.5;
stroke-dasharray: 8 6;
stroke-linecap: round;
fill: none;
}
.ghchart__slope {
font-size: 20px;
font-weight: 700;
letter-spacing: -0.01em;
}
/* Horizontal reference line + label. */
.ghchart__refline {
stroke-width: 2;
stroke-dasharray: 7 6;
stroke-linecap: round;
opacity: 0.85;
}
.ghchart__reflabel {
font-size: 16px;
font-weight: 700;
letter-spacing: -0.01em;
}
/* Data squares — values reveal on hover only. */
.ghchart__square { transition: width 0.12s ease, height 0.12s ease, x 0.12s ease, y 0.12s ease; }
.ghchart__squarehit { fill: transparent; cursor: default; outline: none; }
.ghchart__squarehit:focus-visible {
outline: 2px solid var(–ghc-axis);
outline-offset: 1px;
}
/* Invalid-run markers + leader-line annotations. */
.ghchart__invalid { stroke-width: 2; }
.ghchart__invalid-x { stroke-width: 2; stroke-linecap: round; }
.ghchart__leader { stroke-width: 1; stroke-dasharray: 2 3; opacity: 0.8; }
.ghchart__leader–callout { stroke-dasharray: none; opacity: 0.6; }
.ghchart__anno-title {
font-size: 15px;
font-weight: 700;
letter-spacing: -0.01em;
}
.ghchart__anno-sub {
fill: var(–ghc-muted);
font-size: 13px;
font-weight: 500;
}
/* Final-callout labels read a touch larger than the invalid-run notes. */
.ghchart__anno-title–callout { font-size: 17px; }
.ghchart__anno-sub–callout { font-size: 14px; }
/* Bracket span annotation. */
.ghchart__bracket { stroke: var(–ghc-axis); stroke-width: 1.5; opacity: 0.75; }
.ghchart__bracket-label {
fill: var(–ghc-muted);
font-size: 13px;
font-weight: 700;
letter-spacing: 0.04em;
}
/* Final callout ring. */
.ghchart__callout-ring { fill: none; stroke-width: 2; }
/* —————————————————————— */
/* Title + divider */
/* —————————————————————— */
.ghchart__title {
/* Matches the github.blog H2 (.wp-block-heading) exactly */
display: block;
font-size: 32px;
line-height: 40px;
font-weight: 700;
letter-spacing: -0.18px;
color: var(–ghc-text);
}
.ghchart__rule {
height: 1.5px;
border-radius: 1.5px;
background: var(–ghc-divider);
margin: 10px 0 18px;
}
/* —————————————————————— */
/* Bar chart: subtitle, panels, bars, caption */
/* —————————————————————— */
.ghchart__subtitle {
margin: -6px 0 20px;
font-size: clamp(13px, 1.6vw, 15px);
line-height: 1.5;
color: var(–ghc-muted);
}
.ghchart__panel { margin-top: 30px; }
.ghchart__panel:first-of-type { margin-top: 6px; }
.ghchart__panel-title {
margin: 0 0 6px;
font-size: clamp(15px, 1.9vw, 18px);
font-weight: 700;
letter-spacing: -0.01em;
color: var(–ghc-text);
}
.ghchart__plot–bar { touch-action: pan-y; }
.ghchart__axisline {
stroke: var(–ghc-axis);
stroke-width: 1.25;
opacity: 0.35;
}
.ghchart__bar { transition: opacity 0.12s ease; }
.ghchart__barhit { fill: transparent; }
/* Always-on value labels above selected bars. */
.ghchart__barvalue {
fill: var(–ghc-text);
font-size: 20px;
font-weight: 700;
font-variant-numeric: tabular-nums;
pointer-events: none;
}
/* Anchor annotation: dotted reference line + floating pill. */
.ghchart__anno-line {
stroke: #8b949e;
stroke-width: 1.5;
stroke-dasharray: 4 3;
stroke-linecap: round;
pointer-events: none;
}
.ghchart__anno-chip {
fill: #ffebe9;
stroke: #ffcecb;
stroke-width: 1;
pointer-events: none;
}
.ghchart__anno-chip-text {
fill: #a0111f;
font-weight: 700;
pointer-events: none;
}
.ghchart__caption {
margin-top: 22px;
padding-top: 12px;
border-top: 1px solid var(–ghc-card-border);
font-size: 12.5px;
line-height: 1.55;
color: var(–ghc-muted);
}
.ghchart__caption b { color: var(–ghc-text); font-weight: 700; }
.ghchart__caption code {
font-family: ui-monospace, SFMono-Regular, “SF Mono”, Menlo, Consolas, monospace;
font-size: 0.92em;
padding: 1px 5px;
background: #f6f8fa;
border: 1px solid var(–ghc-card-border);
border-radius: 5px;
}
.ghchart__tag {
display: inline-block;
font-size: 10px;
font-weight: 650;
letter-spacing: 0.03em;
text-transform: uppercase;
padding: 2px 7px;
border-radius: 999px;
border: 1px solid #aceebb;
color: #0a5223;
background: #dafbe1;
white-space: nowrap;
vertical-align: middle;
}
/* —————————————————————— */
/* Distribution dashboard (segmented mix bar + ranked bar panels) */
/* —————————————————————— */
.ghchart__dist-section { margin-top: 28px; }
.ghchart__dist-section:first-of-type { margin-top: 12px; }
/* Segmented proportional “mix” bar: name inside, count/percent below.
Separators are 2px inside borders (box-sizing:border-box) rather than a
flex gap, so the three segments sum to exactly 100% with no overflow. */
.ghchart__seg {
display: flex;
width: 100%;
height: 42px;
margin-top: 2px;
border-radius: 7px;
overflow: hidden;
}
.ghchart__seg-cell {
display: flex;
align-items: center;
justify-content: center;
min-width: 0;
color: #ffffff;
font-size: 15px;
font-weight: 700;
letter-spacing: -0.01em;
white-space: nowrap;
overflow: hidden;
}
.ghchart__seg-cell + .ghchart__seg-cell { border-left: 2px solid var(–ghc-card-bg); }
.ghchart__seg-note-row {
display: flex;
width: 100%;
margin-top: 8px;
}
.ghchart__seg-note {
min-width: 0;
text-align: center;
font-size: 12.5px;
color: var(–ghc-muted);
font-variant-numeric: tabular-nums;
white-space: nowrap;
}
/* Keep the outer notes from spilling past the chart edges. */
.ghchart__seg-note:first-child { text-align: left; }
.ghchart__seg-note:last-child { text-align: right; }
.ghchart__seg-note b { color: var(–ghc-text); font-weight: 700; }
/* Ranked horizontal bar list: [category | bar track | value].
The list is the grid and rows use display:contents, so the category,
bar, and value columns line up across every row in a panel. */
.ghchart__dist-list {
display: grid;
grid-template-columns: max-content 1fr max-content;
align-items: center;
column-gap: 12px;
row-gap: 10px;
margin-top: 4px;
}
.ghchart__dist-row { display: contents; }
.ghchart__dist-cat {
text-align: right;
font-size: 13px;
line-height: 1.25;
color: var(–ghc-text);
white-space: nowrap;
}
.ghchart__dist-track { width: 100%; }
.ghchart__dist-bar {
height: 15px;
min-width: 2px;
border-radius: 3px;
}
.ghchart__dist-val {
font-size: 12.5px;
color: var(–ghc-muted);
font-variant-numeric: tabular-nums;
white-space: nowrap;
}
.ghchart__dist-val b { color: var(–ghc-text); font-weight: 700; }
/* Two-up panel grid (collapses to one column on narrow screens).
minmax(0,1fr) lets columns shrink so long labels never force overflow. */
.ghchart__dist-cols {
margin-top: 26px;
display: grid;
grid-template-columns: repeat(2, minmax(0, 1fr));
gap: 24px 30px;
}
.ghchart__dist-cols .ghchart__dist-section { margin-top: 0; }
.ghchart__dist-cols–stack { grid-template-columns: 1fr; }
.ghchart__dist-cols–stack .ghchart__dist-section { margin-top: 28px; }
.ghchart__dist-cols–stack .ghchart__dist-section:first-child { margin-top: 0; }
/* Tighten the label/value type a touch in the 2-up layout so the bars
keep room at the 699px blog width. */
.ghchart__dist-cols:not(.ghchart__dist-cols–stack) .ghchart__dist-cat { font-size: 12px; }
.ghchart__dist-cols:not(.ghchart__dist-cols–stack) .ghchart__dist-val { font-size: 11.5px; }
.ghchart__dist-cols:not(.ghchart__dist-cols–stack) .ghchart__dist-list { column-gap: 9px; }
@media (max-width: 600px) {
.ghchart__dist-cols { grid-template-columns: 1fr; gap: 26px; }
.ghchart__dist-cols .ghchart__dist-section ~ .ghchart__dist-section { margin-top: 2px; }
}
/* Let long category labels wrap on very narrow (mobile) widths. */
@media (max-width: 480px) {
.ghchart__dist-cat { white-space: normal; }
}
/* —————————————————————— */
/* Calendar heatmap (GitHub contribution-graph style) */
/* —————————————————————— */
.ghheat__eyebrow { display: flex; align-items: center; gap: 8px; margin: 0 0 12px; }
.ghheat__eyedot {
width: 9px; height: 9px; border-radius: 50%;
background: #cf222e; box-shadow: 0 0 0 3px rgba(207, 34, 46, 0.14);
flex: 0 0 auto;
}
.ghheat__eyetext {
font-size: 12px; font-weight: 700; letter-spacing: 0.08em;
text-transform: uppercase; color: #cf222e;
}
/* Subtitle here is a prominent lede, not the muted variant. */
.ghheat__subtitle {
color: var(–ghc-text);
font-size: clamp(14px, 1.7vw, 16px);
/* 24px top gap matches the github.blog H2 → paragraph block spacing. */
margin: 24px 0 8px;
}
.ghheat__subtitle b { font-weight: 700; }
.ghheat__panel { margin-top: 36px; }
.ghheat__phead {
display: flex; align-items: baseline; gap: 9px; flex-wrap: wrap;
margin-bottom: 16px;
}
.ghheat__badge {
display: inline-flex; align-items: center; justify-content: center;
width: 22px; height: 22px; border-radius: 50%;
color: #fff; font-size: 12px; font-weight: 700;
flex: 0 0 auto; align-self: center;
}
.ghheat__ptitle {
font-size: clamp(16px, 2vw, 19px); font-weight: 700;
letter-spacing: -0.01em; color: var(–ghc-text);
}
.ghheat__pdesc { font-size: 14px; color: var(–ghc-muted); }
.ghheat__body { display: flex; gap: 30px; align-items: flex-start; flex-wrap: wrap; }
.ghheat__gridwrap { flex: 1 1 340px; min-width: 260px; }
.ghheat__grid { display: block; width: 100%; height: auto; overflow: visible; }
.ghheat__cell {
stroke: rgba(27, 31, 36, 0.06);
stroke-width: 1;
transition: stroke 0.1s ease;
}
.ghheat__cell:hover { stroke: #24292f; stroke-width: 1.4; }
.ghheat__cell–pad { opacity: 0; pointer-events: none; }
.ghheat__wd, .ghheat__month {
fill: var(–ghc-muted); font-size: 11px; font-weight: 600;
}
.ghheat__side { flex: 1 1 250px; min-width: 230px; }
.ghheat__stat { display: flex; align-items: baseline; gap: 7px; }
.ghheat__statbig {
font-size: clamp(26px, 4vw, 34px); font-weight: 800; letter-spacing: -0.02em;
line-height: 1;
}
.ghheat__statsmall { font-size: 15px; font-weight: 600; color: var(–ghc-muted); }
.ghheat__note {
margin: 10px 0 16px; font-size: 14px; line-height: 1.55; color: var(–ghc-muted);
}
.ghheat__note b { color: var(–ghc-text); font-weight: 700; }
.ghheat__legend {
display: flex; align-items: center; gap: 5px;
font-size: 12.5px; color: var(–ghc-muted); flex-wrap: wrap;
}
.ghheat__sw { width: 12px; height: 12px; border-radius: 3px; display: inline-block; flex: 0 0 auto; }
.ghheat__sw–empty { border: 1px solid #d0d7de; }
.ghheat__legunit { margin-left: 2px; }
.ghheat__extra {
display: flex; align-items: flex-start; gap: 7px; margin-top: 14px;
font-size: 12px; line-height: 1.5; color: var(–ghc-muted); max-width: 330px;
}
.ghheat__extra .ghheat__sw { margin-top: 2px; }
/* —————————————————————— */
/* Tooltip */
/* —————————————————————— */
.ghchart__tooltip {
position: absolute;
z-index: 5;
top: 0;
left: 0;
min-width: 128px;
max-width: 260px;
padding: 10px 12px;
background: var(–ghc-card-bg);
border: 1px solid var(–ghc-card-border);
border-radius: 12px;
/* Layered drop shadow from Primer Brand’s ActionMenu (.ActionMenu__menu) */
box-shadow:
0px 100px 80px rgba(0, 0, 0, 0.01),
0px 41px 33px rgba(0, 0, 0, 0.02),
0px 22px 17px rgba(0, 0, 0, 0.02),
0px 12px 10px rgba(0, 0, 0, 0.03),
0px 6px 5px rgba(0, 0, 0, 0.04),
0px 2px 2px rgba(0, 0, 0, 0.07);
pointer-events: none;
opacity: 0;
transform: translate(-50%, -100%);
/* Fade in on show and out on hide; quickly ease left/top when tracking
from one point to the next. The position ease is suppressed on the
first appearance (see chart.js) so the tooltip fades in place rather
than sliding in from its previous spot. */
transition: opacity 0.12s ease,
left 0.1s cubic-bezier(0.4, 0, 0.2, 1),
top 0.1s cubic-bezier(0.4, 0, 0.2, 1);
will-change: opacity, transform, left, top;
}
.ghchart__tooltip[data-visible=”true”] { opacity: 1; }
.ghchart__tt-title {
font-size: 13px;
font-weight: 700;
color: var(–ghc-text);
margin-bottom: 6px;
}
.ghchart__tt-row {
display: flex;
align-items: center;
gap: 8px;
font-size: 13px;
line-height: 1.6;
color: var(–ghc-muted);
}
.ghchart__tt-swatch { width: 10px; height: 10px; border-radius: 3px; flex: 0 0 auto; }
.ghchart__tt-name { flex: 1 1 auto; }
.ghchart__tt-value { font-weight: 700; color: var(–ghc-text); font-variant-numeric: tabular-nums; }
/* Bar tooltip body: a title line + free-form text lines (no swatches). */
.ghchart__tt-line {
font-size: 13px;
line-height: 1.5;
color: var(–ghc-muted);
}
.ghchart__tt-line:first-child { color: var(–ghc-text); font-weight: 600; }
.ghchart__tt-line + .ghchart__tt-line { margin-top: 2px; }
@media (prefers-reduced-motion: reduce) {
.ghchart__dot,
.ghchart__guide,
.ghchart__bar,
.ghchart__pt,
.ghchart__square,
.ghheat__cell,
.ghchart__tooltip { transition: none; }
}
/*
Shared chart engine — reusable renderer for the blog-charts library.
——————————————————————
Exposes window.GHChartEngine = { renderers, render(config, mountEl?) }.
Renderers are keyed by config.type (currently “line”); add a new viz type
by registering GHChartEngine.renderers[] = function (root, config) {…}.
This same file is embedded verbatim at the top of each exported WordPress
chart.js, followed by that chart’s CONFIG + a small auto-boot. It has no
external dependencies and is safe to include more than once on a page.
*/
(function (global) {
“use strict”;
var SVGNS = “http://www.w3.org/2000/svg”;
function el(tag, attrs) {
var node = document.createElementNS(SVGNS, tag);
if (attrs) {
for (var k in attrs) {
if (Object.prototype.hasOwnProperty.call(attrs, k)) {
node.setAttribute(k, attrs[k]);
}
}
}
return node;
}
function html(tag, cls) {
var node = document.createElement(tag);
if (cls) node.className = cls;
return node;
}
function clamp(v, lo, hi) { return v hi ? hi : v; }
var renderers = {};
/* ================================================================
Line chart renderer
================================================================ */
renderers.line = function (root, config) {
// viewBox geometry (design units; scales fluidly to any width).
var VB = { w: 1000, h: 560 };
var M = { top: 30, right: 34, bottom: 56, left: 86 };
// Inset the plotted points slightly from the axis so the first/last
// months (e.g. “Jan”) don’t crowd the y-axis labels (e.g. “50”).
var PAD_X = 18;
var innerW = VB.w – M.left – M.right;
var innerH = VB.h – M.top – M.bottom;
// Reset (in case of re-render) and use a unique id prefix so multiple
// charts on one page never share gradient ids.
root.textContent = “”;
var uid = config.mountId;
var n = config.labels.length;
var yMin = config.yAxis.min;
var yMax = config.yAxis.max;
var step = config.yAxis.step;
// Y-axis tick labels can format differently from the tooltip values
// (e.g. a plain “40” on the axis but “40%” in the tooltip).
var fmtAxis = config.formatAxis || config.formatValue;
var plotW = innerW – 2 * PAD_X;
var stepX = n <= 1 ? 0 : plotW / (n – 1);
function xAt(i) { return n <= 1 ? M.left + innerW / 2 : M.left + PAD_X + stepX * i; }
function yAt(v) { return M.top + innerH * (1 – (v – yMin) / (yMax – yMin)); }
var baseY = yAt(yMin);
/* —- Title + divider (top) ———————————- */
var title = html("span", "ghchart__title");
title.textContent = config.title;
root.appendChild(title);
root.appendChild(html("div", "ghchart__rule"));
/* —- Header + legend —————————————- */
if (!config.hideLegend) {
var header = html("div", "ghchart__header");
var legend = html("div", "ghchart__legend");
config.series.forEach(function (s) {
var item = html("span", "ghchart__legend-item");
var sw = html("span", "ghchart__swatch");
sw.style.background = s.color;
item.appendChild(sw);
item.appendChild(document.createTextNode(s.name));
legend.appendChild(item);
});
header.appendChild(legend);
root.appendChild(header);
}
/* —- SVG plot ———————————————– */
var svg = el("svg", {
"class": "ghchart__plot",
viewBox: "0 0 " + VB.w + " " + VB.h,
preserveAspectRatio: "xMidYMid meet",
role: "img",
"aria-label": config.title + " line chart"
});
// Gradient defs (one per area series).
var defs = el("defs");
config.series.forEach(function (s, si) {
if (!s.area) return;
var g = el("linearGradient", {
id: uid + "-grad-" + si, x1: "0", y1: "0", x2: "0", y2: "1"
});
g.appendChild(el("stop", { offset: "0", "stop-color": s.color, "stop-opacity": "0.28" }));
g.appendChild(el("stop", { offset: "0.55", "stop-color": s.color, "stop-opacity": "0.08" }));
g.appendChild(el("stop", { offset: "1", "stop-color": s.color, "stop-opacity": "0" }));
defs.appendChild(g);
});
// Diagonal-hatch pattern for an optional "partial / projected" band.
if (config.projection) {
var pat = el("pattern", {
id: uid + "-hatch", width: 7, height: 7,
patternUnits: "userSpaceOnUse", patternTransform: "rotate(45)"
});
pat.appendChild(el("line", {
x1: 0, y1: 0, x2: 0, y2: 7,
stroke: config.projection.color || "#8c959f",
"stroke-width": 1.1, "stroke-opacity": 0.5
}));
defs.appendChild(pat);
}
svg.appendChild(defs);
// Gridlines + y-axis labels.
for (var v = yMin; v cubic Bezier) path builder.
function smooth(points) {
if (!points.length) return “”;
if (points.length < 2) return "M" + points[0].x + "," + points[0].y;
var d = "M " + points[0].x + "," + points[0].y;
for (var i = 0; i < points.length – 1; i++) {
var p0 = points[i – 1] || points[i];
var p1 = points[i];
var p2 = points[i + 1];
var p3 = points[i + 2] || p2;
var t = 1 / 6;
var c1x = p1.x + (p2.x – p0.x) * t;
var c1y = p1.y + (p2.y – p0.y) * t;
var c2x = p2.x – (p3.x – p1.x) * t;
var c2y = p2.y – (p3.y – p1.y) * t;
d += " C " + c1x + "," + c1y + " " + c2x + "," + c2y + " " + p2.x + "," + p2.y;
}
return d;
}
// Area fills (drawn first, behind lines).
config.series.forEach(function (s, si) {
if (!s.area) return;
var p = pts[si];
var d = smooth(p) + " L " + p[p.length – 1].x + "," + baseY +
" L " + p[0].x + "," + baseY + " Z";
svg.appendChild(el("path", { d: d, fill: "url(#" + uid + "-grad-" + si + ")" }));
});
// Vertical hover guide (hidden until hover).
var guide = el("line", {
"class": "ghchart__guide",
x1: xAt(0), y1: M.top – 6, x2: xAt(0), y2: baseY
});
svg.appendChild(guide);
// Lines (draw in reverse so the first series sits on top).
config.series.slice().reverse().forEach(function (s) {
var si = config.series.indexOf(s);
svg.appendChild(el("path", {
"class": "ghchart__line",
d: smooth(pts[si]),
stroke: s.color,
"stroke-width": s.width || (si === 0 ? 4 : 3.25)
}));
});
// Dots (keep references for hover emphasis). When config.hideDots is set
// (dense daily lines), dots rest invisible and only the hovered one shows.
var dotEls = config.series.map(function (s, si) {
return pts[si].map(function (pt) {
var c = el("circle", {
"class": "ghchart__dot",
cx: pt.x, cy: pt.y,
r: config.hideDots ? 0 : (si === 0 ? 4.5 : 4),
fill: s.color
});
svg.appendChild(c);
return c;
});
});
// Transparent hit area for pointer capture.
var hit = el("rect", {
"class": "ghchart__hit",
x: M.left,
y: M.top – 6,
width: innerW,
height: baseY – M.top + 12
});
svg.appendChild(hit);
root.appendChild(svg);
/* —- Tooltip ———————————————— */
var tip = html("div", "ghchart__tooltip");
tip.setAttribute("role", "status");
var tipTitle = html("div", "ghchart__tt-title");
tip.appendChild(tipTitle);
var tipRows = config.series.map(function (s) {
var row = html("div", "ghchart__tt-row");
var sw = html("span", "ghchart__tt-swatch");
sw.style.background = s.color;
var name = html("span", "ghchart__tt-name");
name.textContent = s.name;
var val = html("span", "ghchart__tt-value");
row.appendChild(sw);
row.appendChild(name);
row.appendChild(val);
tip.appendChild(row);
return val;
});
root.appendChild(tip);
/* —- Hover / focus interactivity —————————- */
var activeIndex = -1;
var baseR = config.series.map(function (s, si) {
return config.hideDots ? 0 : (si === 0 ? 4.5 : 4);
});
// Radius of the single emphasized dot under the pointer.
var dotActiveR = config.series.map(function (s, si) {
return config.hideDots ? 6 : baseR[si] + 2.5;
});
var motionMQ = window.matchMedia
? window.matchMedia("(prefers-reduced-motion: reduce)")
: null;
function reduceMotion() { return !!(motionMQ && motionMQ.matches); }
function indexFromClientX(clientX) {
var rect = svg.getBoundingClientRect();
var relX = (clientX – rect.left) / rect.width * VB.w;
var i = stepX ? Math.round((relX – (M.left + PAD_X)) / stepX) : 0;
return clamp(i, 0, n – 1);
}
function show(i) {
if (i === activeIndex) return;
var reappearing = activeIndex === -1;
activeIndex = i;
guide.setAttribute("x1", xAt(i));
guide.setAttribute("x2", xAt(i));
guide.style.opacity = "1";
// Emphasize the hovered column's dots; reset the rest.
dotEls.forEach(function (col, si) {
col.forEach(function (c, ci) {
c.setAttribute("r", ci === i ? dotActiveR[si] : baseR[si]);
});
});
// Fill tooltip.
tipTitle.textContent = config.labels[i];
config.series.forEach(function (s, si) {
tipRows[si].textContent = config.formatValue(s.values[i]);
});
// Anchor above the highest point in this column.
var topSi = 0, topY = Infinity;
config.series.forEach(function (s, si) {
var yy = yAt(s.values[i]);
if (yy < topY) { topY = yy; topSi = si; }
});
var anchor = dotEls[topSi][i].getBoundingClientRect();
var rootRect = root.getBoundingClientRect();
var left = anchor.left + anchor.width / 2 – rootRect.left;
var top = anchor.top – rootRect.top – 12;
// On the first appearance, fade in exactly at the point: suppress the
// position ease so it doesn't slide in from its previous resting spot.
var suppress = reappearing && !reduceMotion();
if (suppress) tip.style.transition = "opacity 0.12s ease";
tip.setAttribute("data-visible", "true");
// Clamp horizontally within the container.
var halfW = tip.offsetWidth / 2;
left = clamp(left, halfW + 2, root.clientWidth – halfW – 2);
// Flip below the point if there's no room above.
if (top – tip.offsetHeight < 0) {
top = anchor.bottom – rootRect.top + 12;
tip.style.transform = "translate(-50%, 0)";
} else {
tip.style.transform = "translate(-50%, -100%)";
}
tip.style.left = left + "px";
tip.style.top = top + "px";
// Commit that position without animating, then restore the CSS
// transition so subsequent point-to-point moves ease into place.
if (suppress) {
void tip.offsetWidth;
tip.style.transition = "";
}
}
function hide() {
activeIndex = -1;
guide.style.opacity = "0";
tip.setAttribute("data-visible", "false");
dotEls.forEach(function (col, si) {
col.forEach(function (c) { c.setAttribute("r", baseR[si]); });
});
}
hit.addEventListener("pointermove", function (e) { show(indexFromClientX(e.clientX)); });
hit.addEventListener("pointerdown", function (e) { show(indexFromClientX(e.clientX)); });
hit.addEventListener("pointerleave", hide);
// Keyboard access.
svg.setAttribute("tabindex", "0");
svg.addEventListener("keydown", function (e) {
if (e.key === "ArrowRight" || e.key === "ArrowLeft") {
var start = activeIndex { title, lines:[…] } }
No printed value labels — values surface on hover (consistent with
the line chart). Bars use a single tunable color with rounded tops.
================================================================ */
renderers.bar = function (root, config) {
root.textContent = “”;
var barColor = (config.series && config.series[0] && config.series[0].color) || “#ff7b72”;
var barRadius = config.barRadius != null ? config.barRadius : 8;
// Per-bar fill: a bar may point at a different series (e.g. a muted
// “preliminary” color) via panel.barSeries[index]; otherwise series[0].
function barColorFor(panel, j) {
var si = (panel.barSeries && panel.barSeries[j] != null) ? panel.barSeries[j] : 0;
var s = config.series && config.series[si];
return (s && s.color) || barColor;
}
var motionMQ = window.matchMedia
? window.matchMedia(“(prefers-reduced-motion: reduce)”)
: null;
function reduceMotion() { return !!(motionMQ && motionMQ.matches); }
/* —- Title + divider (+ optional subtitle) —————— */
var title = html(“span”, “ghchart__title”);
title.textContent = config.title;
root.appendChild(title);
root.appendChild(html(“div”, “ghchart__rule”));
if (config.subtitle) {
var sub = html(“p”, “ghchart__subtitle”);
sub.textContent = config.subtitle;
root.appendChild(sub);
}
/* —- One shared tooltip for all panels ———————- */
var tip = html(“div”, “ghchart__tooltip”);
tip.setAttribute(“role”, “status”);
var tipTitle = html(“div”, “ghchart__tt-title”);
var tipBody = html(“div”, “ghchart__tt-body”);
tip.appendChild(tipTitle);
tip.appendChild(tipBody);
root.appendChild(tip);
var allBars = []; // { el, pi, bi }
var activeKey = null; // “pi:bi” of the hovered bar
function hideTip() {
activeKey = null;
tip.setAttribute(“data-visible”, “false”);
allBars.forEach(function (b) { b.el.style.opacity = “1”; });
}
// Hoisted: referenced by the per-column pointer handlers below.
function showTip(pi, bi, panel, panelBars) {
var reappearing = activeKey === null;
activeKey = pi + “:” + bi;
allBars.forEach(function (b) {
b.el.style.opacity = (b.pi === pi && b.bi === bi) ? “1” : “0.42”;
});
var content = panel.tooltip
? panel.tooltip(bi, panel)
: { title: (panel.labels || [])[bi],
lines: [ (panel.formatValue || String)(panel.values[bi]) ] };
tipTitle.textContent = content.title != null ? content.title : “”;
tipBody.textContent = “”;
(content.lines || []).forEach(function (ln) {
var row = html(“div”, “ghchart__tt-line”);
row.textContent = ln;
tipBody.appendChild(row);
});
var anchor = panelBars[bi].el.getBoundingClientRect();
var rootRect = root.getBoundingClientRect();
var left = anchor.left + anchor.width / 2 – rootRect.left;
var top = anchor.top – rootRect.top – 12;
var suppress = reappearing && !reduceMotion();
if (suppress) tip.style.transition = “opacity 0.12s ease”;
tip.setAttribute(“data-visible”, “true”);
var halfW = tip.offsetWidth / 2;
left = clamp(left, halfW + 2, root.clientWidth – halfW – 2);
if (top – tip.offsetHeight 0) {
for (var v = yMin; v <= yMax + 1e-9; v += step) {
var gy = yAt(v);
svg.appendChild(el("line", {
"class": "ghchart__gridline", x1: M.left, y1: gy, x2: VB.w – M.right, y2: gy
}));
var yl = el("text", {
"class": "ghchart__axislabel ghchart__axislabel–y",
x: M.left – 18, y: gy, dy: "0.32em", "text-anchor": "end"
});
yl.textContent = fmt(v);
svg.appendChild(yl);
}
}
// Solid baseline.
svg.appendChild(el("line", {
"class": "ghchart__axisline", x1: M.left, y1: baseY, x2: VB.w – M.right, y2: baseY
}));
// x-axis labels.
for (var i = 0; i < nb; i++) {
var xl = el("text", {
"class": "ghchart__axislabel ghchart__axislabel–x",
x: xCenter(i), y: VB.h – M.bottom + 30, "text-anchor": "middle"
});
if (panel.xLabelSize) xl.setAttribute("style", "font-size:" + panel.xLabelSize + "px");
xl.textContent = labels[i];
svg.appendChild(xl);
}
// Bars (rounded top corners only) + full-height hover columns.
var panelBars = [];
for (var j = 0; j dark ramp is derived from a single tunable base color.
================================================================ */
renderers.heatmap = function (root, config) {
root.textContent = “”;
var WHITE = [255, 255, 255], BLACK = [0, 0, 0];
function hexToRgb(h) {
h = String(h).replace(“#”, “”);
if (h.length === 3) h = h[0] + h[0] + h[1] + h[1] + h[2] + h[2];
return [parseInt(h.slice(0, 2), 16), parseInt(h.slice(2, 4), 16), parseInt(h.slice(4, 6), 16)];
}
function rgbToHex(c) {
return “#” + c.map(function (x) {
x = Math.max(0, Math.min(255, Math.round(x)));
return (x level 4 dark) from one hex.
function rampFrom(baseHex) {
var b = hexToRgb(baseHex);
return [
rgbToHex(mix(b, WHITE, 0.80)),
rgbToHex(mix(b, WHITE, 0.52)),
rgbToHex(mix(b, WHITE, 0.20)),
baseHex,
rgbToHex(mix(b, BLACK, 0.30))
];
}
function trim0(s) { return s.replace(/.0$/, “”); }
function fmtM(v) {
if (v >= 1000) { var g = v / 1000; return (g >= 10 ? Math.round(g) : trim0(g.toFixed(1))) + “B”; }
if (v >= 1) return trim0(v.toFixed(1)) + “M”;
return Math.round(v * 1000) + “K”;
}
var MON = [“Jan”, “Feb”, “Mar”, “Apr”, “May”, “Jun”, “Jul”, “Aug”, “Sep”, “Oct”, “Nov”, “Dec”];
var MON_FULL = [“January”, “February”, “March”, “April”, “May”, “June”,
“July”, “August”, “September”, “October”, “November”, “December”];
var WD = [“Sun”, “Mon”, “Tue”, “Wed”, “Thu”, “Fri”, “Sat”];
var year = config.year || 2026;
var startM = config.startMonth != null ? config.startMonth : 0;
var endM = config.endMonth != null ? config.endMonth : 5;
var emptyColor = config.emptyColor || “#ebedf0”;
function daysInMonth(y, m) { return new Date(y, m + 1, 0).getDate(); }
function parseISO(s) { var p = s.split(“-“); return new Date(+p[0], +p[1] – 1, +p[2]); }
function dayStart(dt) { return new Date(dt.getFullYear(), dt.getMonth(), dt.getDate()); }
/* —- Eyebrow + title + subtitle —————————– */
if (config.eyebrow) {
var eb = html(“div”, “ghheat__eyebrow”);
eb.appendChild(html(“span”, “ghheat__eyedot”));
var ebt = html(“span”, “ghheat__eyetext”);
ebt.textContent = config.eyebrow;
eb.appendChild(ebt);
root.appendChild(eb);
}
var title = html(“span”, “ghchart__title”);
title.textContent = config.title;
root.appendChild(title);
if (config.subtitle) {
var sub = html(“p”, “ghchart__subtitle ghheat__subtitle”);
sub.innerHTML = config.subtitle;
root.appendChild(sub);
}
/* —- One shared tooltip ————————————– */
var tip = html(“div”, “ghchart__tooltip”);
tip.setAttribute(“role”, “status”);
var tipTitle = html(“div”, “ghchart__tt-title”);
var tipBody = html(“div”, “ghchart__tt-body”);
tip.appendChild(tipTitle);
tip.appendChild(tipBody);
root.appendChild(tip);
var motionMQ = window.matchMedia ? window.matchMedia(“(prefers-reduced-motion: reduce)”) : null;
function reduceMotion() { return !!(motionMQ && motionMQ.matches); }
var activeCell = null;
function hideTip() { activeCell = null; tip.setAttribute(“data-visible”, “false”); }
function showTip(rectEl, titleText, lines) {
var reappearing = activeCell === null;
activeCell = rectEl;
tipTitle.textContent = titleText;
tipBody.textContent = “”;
lines.forEach(function (ln) {
var r = html(“div”, “ghchart__tt-line”);
r.innerHTML = ln;
tipBody.appendChild(r);
});
var a = rectEl.getBoundingClientRect(), rr = root.getBoundingClientRect();
var left = a.left + a.width / 2 – rr.left, top = a.top – rr.top – 12;
var suppress = reappearing && !reduceMotion();
if (suppress) tip.style.transition = “opacity 0.12s ease”;
tip.setAttribute(“data-visible”, “true”);
var halfW = tip.offsetWidth / 2;
left = clamp(left, halfW + 2, root.clientWidth – halfW – 2);
if (top – tip.offsetHeight < 0) {
top = a.bottom – rr.top + 12;
tip.style.transform = "translate(-50%, 0)";
} else {
tip.style.transform = "translate(-50%, -100%)";
}
tip.style.left = left + "px";
tip.style.top = top + "px";
if (suppress) { void tip.offsetWidth; tip.style.transition = ""; }
}
/* —- Panels ————————————————– */
(config.panels || []).forEach(function (panel, pi) {
var base = (config.series && config.series[pi] && config.series[pi].color) || panel.base || "#3094ff";
var ramp = rampFrom(base);
var strong = ramp[4];
var totals = panel.months || [];
var activeVals = [];
for (var mi = startM; mi <= endM; mi++) { if (totals[mi] != null) activeVals.push(totals[mi]); }
var vmin = activeVals.length ? Math.min.apply(null, activeVals) : 0;
var vmax = activeVals.length ? Math.max.apply(null, activeVals) : 1;
function levelFor(t) {
if (t == null) return -1;
if (vmax === vmin) return 4;
return Math.round((t – vmin) / (vmax – vmin) * 4);
}
var af = panel.activeFrom ? parseISO(panel.activeFrom) : new Date(year, startM, 1);
var at = panel.activeTo ? parseISO(panel.activeTo) : new Date(year, endM, daysInMonth(year, endM));
var wrap = html("div", "ghheat__panel");
var head = html("div", "ghheat__phead");
var badge = html("span", "ghheat__badge");
badge.textContent = panel.badge != null ? panel.badge : (pi + 1);
badge.style.background = strong;
head.appendChild(badge);
var pt = html("span", "ghheat__ptitle");
pt.textContent = panel.title;
head.appendChild(pt);
if (panel.descriptor) {
var pd = html("span", "ghheat__pdesc");
pd.textContent = panel.descriptor;
head.appendChild(pd);
}
wrap.appendChild(head);
var body = html("div", "ghheat__body");
/* —- Calendar grid (SVG) —- */
var gridStart = new Date(year, startM, 1);
var gs = new Date(gridStart);
gs.setDate(gs.getDate() – gs.getDay()); // back to Sunday
var gridEnd = new Date(year, endM, daysInMonth(year, endM));
var ge = new Date(gridEnd);
ge.setDate(ge.getDate() + (6 – ge.getDay())); // forward to Saturday
var nCols = Math.round((ge – gs) / (7 * 86400000)) + 1;
var cell = 13, sq = 11, rad = 2.5, labL = 34, labT = 18;
var W = labL + nCols * cell, H = labT + 7 * cell;
var svg = el("svg", {
"class": "ghheat__grid",
viewBox: "0 0 " + W + " " + H,
preserveAspectRatio: "xMinYMin meet",
role: "img",
"aria-label": panel.title + " calendar heatmap"
});
[1, 3, 5].forEach(function (r) {
var t = el("text", {
"class": "ghheat__wd", x: labL – 6, y: labT + r * cell + sq / 2,
dy: "0.32em", "text-anchor": "end"
});
t.textContent = WD[r];
svg.appendChild(t);
});
// Month labels above the column where each month begins.
for (var lm = startM; lm <= endM; lm++) {
var first = new Date(year, lm, 1);
var colOf = Math.floor((dayStart(first) – gs) / (7 * 86400000));
var mlab = el("text", { "class": "ghheat__month", x: labL + colOf * cell, y: 12, "text-anchor": "start" });
mlab.textContent = MON[lm];
svg.appendChild(mlab);
}
var afS = dayStart(af), atS = dayStart(at);
var d = new Date(gs);
for (var i = 0; i = startM && m = afS && ds = 0 ? ramp[lvl] : emptyColor
});
if (inRange) {
(function (dt, mm, has) {
var dateStr = WD[dt.getDay()] + ” u00b7 ” + MON[mm] + ” ” + dt.getDate() + “, ” + year;
var lines;
if (has) {
var daily = totals[mm] / daysInMonth(year, mm);
lines = [
“” + fmtM(daily) + “ ” + panel.legendLabel,
MON_FULL[mm] + ” u00b7 ” + fmtM(totals[mm]) + ” ” + panel.unitTotal
];
} else {
lines = [panel.emptyNote || “No vetted data”];
}
cellEl.addEventListener(“pointermove”, function () { showTip(cellEl, dateStr, lines); });
cellEl.addEventListener(“pointerdown”, function () { showTip(cellEl, dateStr, lines); });
cellEl.addEventListener(“pointerleave”, hideTip);
})(new Date(d), m, hasData);
} else {
cellEl.setAttribute(“class”, “ghheat__cell ghheat__cell–pad”);
}
svg.appendChild(cellEl);
d.setDate(d.getDate() + 1);
}
var gridwrap = html(“div”, “ghheat__gridwrap”);
gridwrap.appendChild(svg);
body.appendChild(gridwrap);
/* —- Side column: stat + note + legend + extra —- */
var side = html(“div”, “ghheat__side”);
if (panel.stat) {
var stat = html(“div”, “ghheat__stat”);
var big = html(“span”, “ghheat__statbig”);
big.textContent = panel.stat.big;
big.style.color = strong;
stat.appendChild(big);
if (panel.stat.small) {
var small = html(“span”, “ghheat__statsmall”);
small.textContent = panel.stat.small;
stat.appendChild(small);
}
side.appendChild(stat);
}
if (panel.note) {
var note = html(“p”, “ghheat__note”);
note.innerHTML = panel.note;
side.appendChild(note);
}
var leg = html(“div”, “ghheat__legend”);
var lw1 = html(“span”, “ghheat__legword”); lw1.textContent = “Fewer”; leg.appendChild(lw1);
ramp.forEach(function (c) {
var s = html(“span”, “ghheat__sw”); s.style.background = c; leg.appendChild(s);
});
var lw2 = html(“span”, “ghheat__legword”); lw2.textContent = “More”; leg.appendChild(lw2);
if (panel.legendLabel) {
var lu = html(“span”, “ghheat__legunit”); lu.textContent = “u00b7 ” + panel.legendLabel; leg.appendChild(lu);
}
side.appendChild(leg);
if (panel.extraNote) {
var ex = html(“div”, “ghheat__extra”);
var exsw = html(“span”, “ghheat__sw ghheat__sw–empty”);
exsw.style.background = emptyColor;
ex.appendChild(exsw);
var ext = html(“span”, “ghheat__extratext”);
ext.innerHTML = panel.extraNote;
ex.appendChild(ext);
side.appendChild(ex);
}
body.appendChild(side);
wrap.appendChild(body);
root.appendChild(wrap);
});
if (config.caption) {
var cap = html(“div”, “ghchart__caption”);
cap.innerHTML = config.caption;
root.appendChild(cap);
}
};
/* ================================================================
Scatter renderer — X/Y numeric plot with categorical points.
Used for cost-vs-quality benchmark charts: a highlighted “primary”
point (glow halo), a “reference” point with a dotted crosshair, and
muted “other” points. Values never print on the marks — a point’s
name shows for identity and the exact (y, x) reveals on hover.
================================================================ */
renderers.scatter = function (root, config) {
root.textContent = “”;
var uid = config.mountId;
var VB = { w: 1000, h: 600 };
var M = { top: 40, right: 30, bottom: 74, left: 96 };
var innerW = VB.w – M.left – M.right;
var innerH = VB.h – M.top – M.bottom;
var xa = config.xAxis, ya = config.yAxis;
var fmtX = xa.format || function (v) { return String(v); };
var fmtY = ya.format || function (v) { return String(v); };
var tipSuffix = config.tipSuffix || “”;
function xAt(v) { return M.left + innerW * (v – xa.min) / (xa.max – xa.min); }
function yAt(v) { return M.top + innerH * (1 – (v – ya.min) / (ya.max – ya.min)); }
var baseY = yAt(ya.min);
var motionMQ = window.matchMedia
? window.matchMedia(“(prefers-reduced-motion: reduce)”)
: null;
function reduceMotion() { return !!(motionMQ && motionMQ.matches); }
function colorOf(pt) {
var s = config.series && config.series[pt.series || 0];
return (s && s.color) || “#8c959f”;
}
/* —- Title (compact narrative headline, no rule) ———— */
var title = html(“div”, “ghchart__headline”);
title.textContent = config.title;
root.appendChild(title);
/* —- Header + legend (from series) ————————– */
if (!config.hideLegend) {
var header = html(“div”, “ghchart__header”);
var legend = html(“div”, “ghchart__legend”);
(config.series || []).forEach(function (s) {
var item = html(“span”, “ghchart__legend-item”);
var sw = html(“span”, “ghchart__swatch ghchart__swatch–dot”);
sw.style.background = s.color;
item.appendChild(sw);
item.appendChild(document.createTextNode(s.name));
legend.appendChild(item);
});
header.appendChild(legend);
root.appendChild(header);
}
/* —- SVG plot ———————————————– */
var svg = el(“svg”, {
“class”: “ghchart__plot ghchart__plot–scatter”,
viewBox: “0 0 ” + VB.w + ” ” + VB.h,
preserveAspectRatio: “xMidYMid meet”,
role: “img”,
“aria-label”: config.title + ” scatter plot”
});
// Gridlines (both directions) + tick labels.
var eps = 1e-6;
for (var yv = ya.min; yv <= ya.max + eps; yv += ya.step) {
var gy = yAt(yv);
svg.appendChild(el("line", {
"class": "ghchart__gridline",
x1: M.left, y1: gy, x2: VB.w – M.right, y2: gy
}));
var yl = el("text", {
"class": "ghchart__axislabel ghchart__axislabel–y",
x: M.left – 16, y: gy, dy: "0.32em", "text-anchor": "end"
});
yl.textContent = fmtY(yv);
svg.appendChild(yl);
}
for (var xv = xa.min; xv <= xa.max + eps; xv += xa.step) {
var gx = xAt(xv);
svg.appendChild(el("line", {
"class": "ghchart__gridline ghchart__gridline–v",
x1: gx, y1: M.top, x2: gx, y2: baseY
}));
var isFirst = Math.abs(xv – xa.min) < eps;
var isLast = Math.abs(xv – xa.max) < eps;
var xl = el("text", {
"class": "ghchart__axislabel ghchart__axislabel–x",
x: gx, y: baseY + 34,
"text-anchor": isFirst ? "start" : (isLast ? "end" : "middle")
});
xl.textContent = fmtX(xv);
svg.appendChild(xl);
}
// Axis titles.
if (xa.title) {
var xt = el("text", {
"class": "ghchart__axistitle",
x: M.left + innerW / 2, y: VB.h – 12, "text-anchor": "middle"
});
xt.textContent = xa.title;
svg.appendChild(xt);
}
if (ya.title) {
var ytX = 24, ytY = M.top + innerH / 2;
var yt = el("text", {
"class": "ghchart__axistitle",
x: ytX, y: ytY, "text-anchor": "middle",
transform: "rotate(-90 " + ytX + " " + ytY + ")"
});
yt.textContent = ya.title;
svg.appendChild(yt);
}
// Reference crosshair through the flagged point (dual dotted lines).
var refPt = (config.points || []).filter(function (p) { return p.reference; })[0];
if (refPt) {
var rColor = colorOf(refPt);
var rx = xAt(refPt.x), ry = yAt(refPt.y);
svg.appendChild(el("line", {
"class": "ghchart__crosshair",
x1: rx, y1: M.top, x2: rx, y2: baseY, stroke: rColor
}));
svg.appendChild(el("line", {
"class": "ghchart__crosshair",
x1: M.left, y1: ry, x2: VB.w – M.right, y2: ry, stroke: rColor
}));
}
// Points: halo (highlight/reference) + dot + name label.
var dotEls = [], hitEls = [];
(config.points || []).forEach(function (pt, i) {
var cx = xAt(pt.x), cy = yAt(pt.y), c = colorOf(pt);
var big = pt.highlight || pt.reference;
if (big) {
svg.appendChild(el("circle", {
"class": "ghchart__halo", cx: cx, cy: cy, r: 17, fill: c
}));
}
var dot = el("circle", {
"class": "ghchart__pt", cx: cx, cy: cy,
r: big ? 9 : 5.5, fill: c
});
svg.appendChild(dot);
dotEls.push({ el: dot, baseR: big ? 9 : 5.5 });
// Name label — bold+colored for the story points, muted for the rest.
var pos = pt.labelPos || (pt.highlight ? "below" : pt.reference ? "above" : "right");
var dx = 0, dy = 0, anchor = "middle";
var gap = big ? 15 : 9;
if (pos === "right") { dx = gap + 4; dy = 5; anchor = "start"; }
else if (pos === "left") { dx = -(gap + 4); dy = 5; anchor = "end"; }
else if (pos === "above") { dy = -(gap + 6); anchor = "middle"; }
else { dy = gap + 16; anchor = "middle"; } // below
var lbl = el("text", {
"class": "ghchart__pt-label" + (big ? " ghchart__pt-label–strong" : ""),
x: cx + dx, y: cy + dy, "text-anchor": anchor,
fill: big ? c : null
});
lbl.textContent = pt.label;
svg.appendChild(lbl);
// Transparent hit target for hover/focus.
var hit = el("circle", {
"class": "ghchart__pthit", cx: cx, cy: cy, r: 20,
tabindex: "0", role: "img",
"aria-label": pt.label + ": " + fmtY(pt.y) + ", " + fmtX(pt.x) + tipSuffix
});
svg.appendChild(hit);
hitEls.push(hit);
});
root.appendChild(svg);
/* —- Tooltip (title + free lines) ————————— */
var tip = html("div", "ghchart__tooltip");
tip.setAttribute("role", "status");
var tipTitle = html("div", "ghchart__tt-title");
var tipBody = html("div", "ghchart__tt-body");
tip.appendChild(tipTitle);
tip.appendChild(tipBody);
root.appendChild(tip);
var activeIndex = -1;
function show(i) {
var pt = config.points[i];
if (!pt) return;
var reappearing = activeIndex === -1;
activeIndex = i;
dotEls.forEach(function (d, di) {
d.el.setAttribute("r", di === i ? d.baseR + 2.5 : d.baseR);
});
tipTitle.textContent = pt.label;
tipBody.textContent = "";
var line = html("div", "ghchart__tt-line");
line.textContent = fmtY(pt.y) + " · " + fmtX(pt.x) + tipSuffix;
tipBody.appendChild(line);
var anchor = dotEls[i].el.getBoundingClientRect();
var rootRect = root.getBoundingClientRect();
var left = anchor.left + anchor.width / 2 – rootRect.left;
var top = anchor.top – rootRect.top – 12;
var suppress = reappearing && !reduceMotion();
if (suppress) tip.style.transition = "opacity 0.12s ease";
tip.setAttribute("data-visible", "true");
var halfW = tip.offsetWidth / 2;
left = clamp(left, halfW + 2, root.clientWidth – halfW – 2);
if (top – tip.offsetHeight 0) {
svg.appendChild(el(“line”, {
“class”: “ghchart__phase-sep”, x1: x0, y1: M.top, x2: x0, y2: baseY
}));
}
var pl = el(“text”, {
“class”: “ghchart__phase-label”, x: (x0 + x1) / 2, y: M.top – 40,
“text-anchor”: “middle”
});
pl.textContent = ph.label;
svg.appendChild(pl);
if (ph.avg) {
var pa = el(“text”, {
“class”: “ghchart__phase-avg”, x: (x0 + x1) / 2, y: M.top + 24,
“text-anchor”: “middle”, fill: cPoint
});
pa.textContent = ph.avg;
svg.appendChild(pa);
}
});
// Horizontal gridlines + y tick labels (skip a gridline at the reference y).
var refY = config.reference ? config.reference.y : null;
(ya.ticks || []).forEach(function (tv) {
var gy = yAt(tv);
if (refY === null || Math.abs(tv – refY) > 1e-9) {
svg.appendChild(el(“line”, {
“class”: “ghchart__gridline”, x1: M.left, y1: gy, x2: VB.w – M.right, y2: gy
}));
}
var yl = el(“text”, {
“class”: “ghchart__axislabel ghchart__axislabel–y”,
x: M.left – 16, y: gy, dy: “0.32em”, “text-anchor”: “end”
});
yl.textContent = fmtY(tv);
svg.appendChild(yl);
});
// X tick labels (dated).
(xa.ticks || []).forEach(function (t) {
var gx = xAt(t.at);
var first = Math.abs(t.at – xa.min) < 1e-9, last = Math.abs(t.at – xa.max) < 1e-9;
var xl = el("text", {
"class": "ghchart__axislabel ghchart__axislabel–x",
x: gx, y: baseY + 30, "text-anchor": first ? "start" : (last ? "end" : "middle")
});
xl.textContent = t.text;
svg.appendChild(xl);
});
// Axis titles.
if (ya.title) {
var ytX = 22, ytY = M.top + innerH / 2;
var yt = el("text", {
"class": "ghchart__axistitle", x: ytX, y: ytY, "text-anchor": "middle",
transform: "rotate(-90 " + ytX + " " + ytY + ")"
});
yt.textContent = ya.title;
svg.appendChild(yt);
}
// Trend: optional ±band (linear only), then the dashed line + slope label.
var tr = config.trend;
if (tr) {
function trendY(x) {
return tr.from.y + (tr.to.y – tr.from.y) * (x – tr.from.x) / (tr.to.x – tr.from.x);
}
if (tr.band && !isLog) {
var p = tr.band;
var pts = [
[xAt(tr.from.x), yAt(trendY(tr.from.x) + p)],
[xAt(tr.to.x), yAt(trendY(tr.to.x) + p)],
[xAt(tr.to.x), yAt(trendY(tr.to.x) – p)],
[xAt(tr.from.x), yAt(trendY(tr.from.x) – p)]
].map(function (a) { return a[0] + "," + a[1]; }).join(" ");
svg.appendChild(el("polygon", {
"class": "ghchart__trendband", points: pts, fill: cTrend
}));
}
svg.appendChild(el("line", {
"class": "ghchart__trendline",
x1: xAt(tr.from.x), y1: yAt(tr.from.y),
x2: xAt(tr.to.x), y2: yAt(tr.to.y), stroke: cTrend
}));
if (tr.label) {
var lx, lyy;
if (tr.labelAt) { lx = xAt(tr.labelAt.x); lyy = yAt(tr.labelAt.y); }
else {
lx = xAt(tr.to.x) + (tr.labelDX == null ? -6 : tr.labelDX);
lyy = yAt(tr.to.y) + (tr.labelDY == null ? -12 : tr.labelDY);
}
var sl = el("text", {
"class": "ghchart__slope", x: lx, y: lyy,
"text-anchor": tr.labelAnchor || "end", fill: cTrend
});
sl.textContent = tr.label;
svg.appendChild(sl);
}
}
// Reference line (horizontal dashed) + right-aligned label.
if (config.reference) {
var rc = config.reference.color || "#24292f";
var ryy = yAt(config.reference.y);
svg.appendChild(el("line", {
"class": "ghchart__refline", x1: M.left, y1: ryy, x2: VB.w – M.right, y2: ryy,
stroke: rc
}));
if (config.reference.label) {
var rl = el("text", {
"class": "ghchart__reflabel", x: VB.w – M.right, y: ryy – 8,
"text-anchor": "end", fill: rc
});
rl.textContent = config.reference.label;
svg.appendChild(rl);
}
}
// Data squares (values reveal on hover only).
var side = 13, hSide = side / 2;
var sqEls = [], hitEls = [];
(config.points || []).forEach(function (pt, i) {
var cx = xAt(pt.x), cy = yAt(pt.y);
var sq = el("rect", {
"class": "ghchart__square", x: cx – hSide, y: cy – hSide,
width: side, height: side, rx: 2, fill: cPoint
});
svg.appendChild(sq);
sqEls.push({ el: sq, cx: cx, cy: cy });
// Hover/focus hit target — omitted when hover is disabled so the
// (illustrative) point values never surface, on screen or to a11y.
if (!config.disableHover) {
var hit = el("rect", {
"class": "ghchart__squarehit", x: cx – 13, y: cy – 13,
width: 26, height: 26, tabindex: "0", role: "img",
"aria-label": (pt.d || "") + " " + fmtY(pt.y)
});
svg.appendChild(hit);
hitEls.push(hit);
}
});
// Invalid-run markers: red diamond + X, leader line, annotation text.
(config.invalids || []).forEach(function (iv) {
var cx = xAt(iv.x), cy = yAt(iv.y);
svg.appendChild(el("rect", {
"class": "ghchart__invalid", x: cx – hSide, y: cy – hSide,
width: side, height: side, rx: 1.5, fill: "none", stroke: cInvalid,
transform: "rotate(45 " + cx + " " + cy + ")"
}));
var q = 3.4;
svg.appendChild(el("line", {
"class": "ghchart__invalid-x", x1: cx – q, y1: cy – q, x2: cx + q, y2: cy + q,
stroke: cInvalid
}));
svg.appendChild(el("line", {
"class": "ghchart__invalid-x", x1: cx – q, y1: cy + q, x2: cx + q, y2: cy – q,
stroke: cInvalid
}));
if (iv.title) {
var tx = cx + (iv.labelDX == null ? 16 : iv.labelDX);
var ty = cy + (iv.labelDY == null ? -26 : iv.labelDY);
svg.appendChild(el("line", {
"class": "ghchart__leader", x1: cx, y1: cy, x2: tx, y2: ty, stroke: cInvalid
}));
var anchor = iv.labelAnchor || "start";
var at = el("text", {
"class": "ghchart__anno-title", x: tx, y: ty – 4, "text-anchor": anchor, fill: cInvalid
});
at.textContent = iv.title;
svg.appendChild(at);
if (iv.sub) {
var asu = el("text", {
"class": "ghchart__anno-sub", x: tx, y: ty + 11, "text-anchor": anchor
});
asu.textContent = iv.sub;
svg.appendChild(asu);
}
}
});
// Bracket annotation (span with end ticks + centered label above).
(config.brackets || []).forEach(function (b) {
var x0 = xAt(b.fromX), x1 = xAt(b.toX), by = yAt(b.y);
svg.appendChild(el("line", {
"class": "ghchart__bracket", x1: x0, y1: by, x2: x1, y2: by
}));
svg.appendChild(el("line", { "class": "ghchart__bracket", x1: x0, y1: by, x2: x0, y2: by + 7 }));
svg.appendChild(el("line", { "class": "ghchart__bracket", x1: x1, y1: by, x2: x1, y2: by + 7 }));
var bl = el("text", {
"class": "ghchart__bracket-label", x: (x0 + x1) / 2, y: by – 8, "text-anchor": "middle"
});
bl.textContent = b.text;
svg.appendChild(bl);
});
// Final callout: ringed point + leader + title/sub placed inside the plot.
if (config.callout) {
var co = config.callout;
var ccx = xAt(co.x), ccy = yAt(co.y);
svg.appendChild(el("circle", {
"class": "ghchart__callout-ring", cx: ccx, cy: ccy, r: 12, stroke: cPoint
}));
var ctx = ccx + (co.labelDX == null ? -16 : co.labelDX);
var cty = ccy + (co.labelDY == null ? -30 : co.labelDY);
svg.appendChild(el("line", {
"class": "ghchart__leader ghchart__leader–callout", x1: ccx, y1: ccy, x2: ctx, y2: cty,
stroke: cPoint
}));
var can = co.labelAnchor || "end";
var ct = el("text", {
"class": "ghchart__anno-title ghchart__anno-title–callout", x: ctx, y: cty – 4, "text-anchor": can, fill: cPoint
});
ct.textContent = co.title;
svg.appendChild(ct);
if (co.sub) {
var cs = el("text", {
"class": "ghchart__anno-sub ghchart__anno-sub–callout", x: ctx, y: cty + 12, "text-anchor": can
});
cs.textContent = co.sub;
svg.appendChild(cs);
}
}
root.appendChild(svg);
if (config.caption) {
var cap = html("div", "ghchart__caption");
cap.textContent = config.caption;
root.appendChild(cap);
}
/* —- Tooltip + hover interaction (skipped when disabled) —— */
if (!config.disableHover) {
var tip = html("div", "ghchart__tooltip");
tip.setAttribute("role", "status");
var tipTitle = html("div", "ghchart__tt-title");
var tipBody = html("div", "ghchart__tt-body");
tip.appendChild(tipTitle);
tip.appendChild(tipBody);
root.appendChild(tip);
var activeIndex = -1;
function show(i) {
var pt = config.points[i];
if (!pt) return;
var reappearing = activeIndex === -1;
activeIndex = i;
sqEls.forEach(function (s, si) {
var big = si === i;
var w = big ? side + 5 : side;
s.el.setAttribute("width", w);
s.el.setAttribute("height", w);
s.el.setAttribute("x", s.cx – w / 2);
s.el.setAttribute("y", s.cy – w / 2);
});
var tipInfo = config.pointTip
? config.pointTip(pt)
: { title: pt.d || "", line: fmtY(pt.y) };
tipTitle.textContent = tipInfo.title;
tipBody.textContent = "";
var line = html("div", "ghchart__tt-line");
line.textContent = tipInfo.line;
tipBody.appendChild(line);
var anchor = sqEls[i].el.getBoundingClientRect();
var rootRect = root.getBoundingClientRect();
var left = anchor.left + anchor.width / 2 – rootRect.left;
var top = anchor.top – rootRect.top – 12;
var suppress = reappearing && !reduceMotion();
if (suppress) tip.style.transition = "opacity 0.12s ease";
tip.setAttribute("data-visible", "true");
var halfW = tip.offsetWidth / 2;
left = clamp(left, halfW + 2, root.clientWidth – halfW – 2);
if (top – tip.offsetHeight < 0) {
top = anchor.bottom – rootRect.top + 12;
tip.style.transform = "translate(-50%, 0)";
} else {
tip.style.transform = "translate(-50%, -100%)";
}
tip.style.left = left + "px";
tip.style.top = top + "px";
if (suppress) { void tip.offsetWidth; tip.style.transition = ""; }
}
function hide() {
activeIndex = -1;
tip.setAttribute("data-visible", "false");
sqEls.forEach(function (s) {
s.el.setAttribute("width", side);
s.el.setAttribute("height", side);
s.el.setAttribute("x", s.cx – hSide);
s.el.setAttribute("y", s.cy – hSide);
});
}
hitEls.forEach(function (hit, i) {
hit.addEventListener("pointerenter", function () { show(i); });
hit.addEventListener("pointermove", function () { show(i); });
hit.addEventListener("pointerleave", hide);
hit.addEventListener("focus", function () { show(i); });
hit.addEventListener("blur", hide);
});
}
};
/* ================================================================
Distribution dashboard renderer
—————————————————————-
A composition figure (no hover — every value is printed as text, so
the marks are inherently screen-reader accessible):
• a compact narrative headline + muted subtitle;
• an optional segmented "mix" bar — proportional colored segments,
each with its name inside and count/percent below;
• one or more panels of ranked horizontal bars, each row printing
its category (left), a bar, and its count/percent (right).
Colors come from config.series so the harness can tune them live:
series[0] = bar fill (single base hex);
series[1..] = segment fills, in the order of config.segments.items.
================================================================ */
renderers.distribution = function (root, config) {
root.textContent = "";
root.setAttribute("role", "img");
if (config.title) root.setAttribute("aria-label", config.title);
var series = config.series || [];
var barColor = (series[0] && series[0].color) || "#8250df";
var total = config.total ||
(config.segments && config.segments.items
? config.segments.items.reduce(function (a, b) { return a + b.value; }, 0)
: 0);
function pctText(v) {
if (!total) return "";
return (Math.round((v / total) * 1000) / 10).toFixed(1) + "%";
}
function valueHTML(v) {
var p = pctText(v);
return "” + v + “” + (p ? ” (” + p + “)” : “”);
}
/* —- Headline + subtitle ————————————- */
if (config.title) {
var head = html(“div”, “ghchart__headline”);
head.textContent = config.title;
root.appendChild(head);
}
if (config.subtitle) {
var sub = html(“p”, “ghchart__subtitle”);
sub.textContent = config.subtitle;
root.appendChild(sub);
}
/* —- Segmented “mix” bar ————————————– */
var seg = config.segments;
if (seg && seg.items && seg.items.length) {
var segSec = html(“div”, “ghchart__dist-section”);
if (seg.title) {
var segTitle = html(“div”, “ghchart__panel-title”);
segTitle.textContent = seg.title;
segSec.appendChild(segTitle);
}
var segTotal = seg.items.reduce(function (a, b) { return a + b.value; }, 0) || 1;
var bar = html(“div”, “ghchart__seg”);
var notes = html(“div”, “ghchart__seg-note-row”);
seg.items.forEach(function (it, i) {
var basis = (it.value / segTotal) * 100;
var col = (series[i + 1] && series[i + 1].color) || it.color || barColor;
var cell = html(“div”, “ghchart__seg-cell”);
cell.style.flex = “0 0 ” + basis + “%”;
cell.style.background = col;
cell.textContent = it.label;
bar.appendChild(cell);
var note = html(“div”, “ghchart__seg-note”);
note.style.flex = “0 0 ” + basis + “%”;
note.innerHTML = valueHTML(it.value);
notes.appendChild(note);
});
segSec.appendChild(bar);
segSec.appendChild(notes);
root.appendChild(segSec);
}
/* —- Ranked bar panels (grid: 2-up, stacking on narrow) —— */
var panels = config.panels || [];
if (panels.length) {
var cols = html(“div”, “ghchart__dist-cols”);
if (config.columns === 1 || panels.length === 1) {
cols.classList.add(“ghchart__dist-cols–stack”);
}
panels.forEach(function (panel) {
var sec = html(“div”, “ghchart__dist-section”);
if (panel.title) {
var pt = html(“div”, “ghchart__panel-title”);
pt.textContent = panel.title;
sec.appendChild(pt);
}
var list = html(“div”, “ghchart__dist-list”);
var pmax = (panel.items || []).reduce(function (m, it) {
return it.value > m ? it.value : m;
}, 0) || 1;
(panel.items || []).forEach(function (it) {
var row = html(“div”, “ghchart__dist-row”);
var cat = html(“div”, “ghchart__dist-cat”);
cat.textContent = it.label;
row.appendChild(cat);
var track = html(“div”, “ghchart__dist-track”);
var b = html(“div”, “ghchart__dist-bar”);
b.style.width = Math.max((it.value / pmax) * 100, 1.2) + “%”;
b.style.background = it.color || barColor;
track.appendChild(b);
row.appendChild(track);
var val = html(“div”, “ghchart__dist-val”);
val.innerHTML = valueHTML(it.value);
row.appendChild(val);
list.appendChild(row);
});
sec.appendChild(list);
cols.appendChild(sec);
});
root.appendChild(cols);
}
/* —- Caption / footnote ————————————– */
if (config.caption) {
var cap = html(“div”, “ghchart__caption”);
cap.innerHTML = config.caption;
root.appendChild(cap);
}
};
/* ================================================================
Dispatcher — pick a renderer by config.type and draw into a mount
================================================================ */
function render(config, mountEl) {
var root = mountEl || document.getElementById(config.mountId);
if (!root) return;
root.classList.add(“ghchart”);
/* Resolve the renderer from the SHARED registry (see registration below),
not this bundle’s private `renderers`. When several exported charts share
one page they all merge into one registry, so every chart finds its
renderer even if an older engine bundle loaded first. */
var reg = (global.GHChartEngine && global.GHChartEngine.renderers) || renderers;
var fn = reg[config.type] || renderers[config.type] || reg.line || renderers.line;
fn(root, config);
}
/* —————————————————————-
Shared-engine registration (multi-embed safe)
—————————————————————-
Every exported chart.js embeds this whole engine. When two or more
charts are placed on the same page (e.g. a WordPress post), we must NOT
let the first-loaded bundle silently win — an older bundle would be
missing renderers added later (this is why a heatmap pasted after an
older bar chart used to vanish).
Instead we keep ONE shared engine:
• every bundle merges in any renderers the shared registry lacks;
• the newest bundle (highest ENGINE_VERSION) provides render(), which
reads renderers from the shared registry at call time.
The result is order-independent and resilient to version skew as new
chart types are added. Bump ENGINE_VERSION whenever renderers or render
change so a newer embed upgrades an older shared engine in place. */
var ENGINE_VERSION = 9;
var existing = global.GHChartEngine;
if (existing && typeof existing.version === “number”) {
if (ENGINE_VERSION > existing.version) {
/* This bundle is newer. Every export embeds the COMPLETE engine, so this
bundle’s `renderers` is a self-contained, up-to-date set. Adopt it as
the shared registry (upgrading older same-named renderers in place),
while defensively preserving any renderer types only the older engine
happened to have. Then take over render(). */
for (var ek in existing.renderers) {
if (Object.prototype.hasOwnProperty.call(existing.renderers, ek) && !renderers[ek]) {
renderers[ek] = existing.renderers[ek];
}
}
existing.renderers = renderers;
existing.render = render;
existing.version = ENGINE_VERSION;
} else {
/* Same or older version already present: only contribute renderer types
the shared registry is missing (don’t clobber an equal/newer engine). */
for (var rk in renderers) {
if (Object.prototype.hasOwnProperty.call(renderers, rk) && !existing.renderers[rk]) {
existing.renderers[rk] = renderers[rk];
}
}
}
} else {
/* No engine yet, or a pre-versioning (old-style) engine loaded first.
Take over, preserving any renderers the old-style engine registered. */
if (existing && existing.renderers) {
for (var ok in existing.renderers) {
if (Object.prototype.hasOwnProperty.call(existing.renderers, ok) && !renderers[ok]) {
renderers[ok] = existing.renderers[ok];
}
}
}
global.GHChartEngine = { renderers: renderers, render: render, version: ENGINE_VERSION };
}
})(typeof window !== “undefined” ? window : this);
;(function () {
“use strict”;
var CONFIG = {
mountId: “gh-chart-hf-completion”,
type: “trend”,
disableHover: true,
title: “HydraFusion recovered from two operational breaks and continued climbing on August 25 to 91.8% best-of-2 equivalent.”,
subtitle: “28 August 25 completion points. Filled HydraFusion squares use the same encoding from first observation to last, and the robust trend includes the final result.”,
series: [
{
name: “HydraFusion”,
color: “#8250df”,
glyph: “square”
},
{
name: “Harness-invalid run”,
color: “#cf222e”,
glyph: “invalid”
}
],
legendExtra: [
{
name: “Robust trend”,
glyph: “line”,
color: “#8250df”
}
],
xAxis: {
min: 11,
max: 26.15,
ticks: [
{
at: 11,
text: “Aug 11”
},
{
at: 13,
text: “Aug 13”
},
{
at: 15,
text: “Aug 15”
},
{
at: 17,
text: “Aug 17”
},
{
at: 19,
text: “Aug 19”
},
{
at: 21,
text: “Aug 21”
},
{
at: 23,
text: “Aug 23”
},
{
at: 25,
text: “Aug 25”
}
]
},
yAxis: {
scale: “linear”,
min: 0,
max: 89,
ticks: [0, 20, 40, 60, 77, 89],
title: “TASKS RESOLVED · OF 89”,
format: function (v) { return String(v); }
},
phases: [
{
from: 11,
to: 18,
label: “REPAIR”
},
{
from: 18,
to: 22,
label: “REVIEW”
},
{
from: 22,
to: 26.15,
label: “RELEASE”
}
],
reference: {
y: 77,
color: “#24292f”
},
trend: {
from: {
x: 11,
y: 64.1
},
to: {
x: 26.15,
y: 74.7
},
band: 7.3,
label: “+0.7 tasks/day”,
labelAnchor: “middle”,
labelAt: {
x: 25.3,
y: 69
}
},
brackets: [
{
fromX: 19.4,
toX: 20.9,
y: 83,
text: “11 RERUNS · ±7.3-TASK NOISE”
}
],
invalids: [
{
x: 11.33,
y: 0,
title: “AUG 11 · FALLBACK FAILURE”,
sub: “0/89 · 89/89 AGENT ERRORS”,
labelDX: 28,
labelDY: -64,
labelAnchor: “start”
},
{
x: 14.07,
y: 40,
title: “AUG 14 · SECOND HARNESS BREAK”,
labelDX: 26,
labelDY: -46,
labelAnchor: “start”
}
],
points: [
{
x: 11.06,
y: 67
},
{
x: 11.68,
y: 75
},
{
x: 13.22,
y: 70
},
{
x: 13.81,
y: 73
},
{
x: 14.18,
y: 67
},
{
x: 18.09,
y: 76
},
{
x: 18.53,
y: 66
},
{
x: 18.86,
y: 67
},
{
x: 19.44,
y: 72
},
{
x: 19.58,
y: 65
},
{
x: 19.58,
y: 70
},
{
x: 19.71,
y: 64
},
{
x: 19.85,
y: 69
},
{
x: 19.99,
y: 67
},
{
x: 20.12,
y: 69
},
{
x: 20.25,
y: 73
},
{
x: 20.39,
y: 72
},
{
x: 20.52,
y: 66
},
{
x: 20.66,
y: 67
},
{
x: 20.83,
y: 71
},
{
x: 20.97,
y: 72
},
{
x: 22.31,
y: 76
},
{
x: 23.44,
y: 69
},
{
x: 24.34,
y: 74
},
{
x: 25.56,
y: 77
},
{
x: 26.02,
y: 82
}
],
pointTip: function (pt) {
return { title: “Aug ” + Math.round(pt.x), line: pt.y + ” of 89 tasks” };
}
};
function boot() {
var root = document.getElementById(CONFIG.mountId);
if (!root || root.getAttribute(“data-gh-rendered”)) return;
root.setAttribute(“data-gh-rendered”, “1”);
window.GHChartEngine.render(CONFIG);
}
if (document.readyState === “loading”) {
document.addEventListener(“DOMContentLoaded”, boot);
} else {
boot();
}
})();
This development record shows how the policies improved from repeated experiments. TerminalBench 2.1 was one of several benchmarks used during development. Its relative saturation makes broader validation important, so the three-benchmark evaluation also includes DeepSWE’s more demanding repository-level tasks. The research preview extends that learning loop to real developer workloads.
Try the research preview
For this preview, first-turn, single-prompt coding tasks are the best place to start. We’ll be focusing on strong multi-turn performance with longer, iterative sessions next.
This preview is designed to learn which tasks benefit from compound workflows and how orchestration affects latency and cost in practice. For the best experience today, start with substantial, well-scoped coding tasks that you can hand to Copilot in autopilot mode in a single prompt. Share what you find, including where it excels, where it falls short, and what you’d want to see next, through /feedback in Copilot CLI or in the GitHub Community discussion.
HydraFusion remains an active research effort. Results, models, workflows, availability, names, and product behavior may change as we learn from the preview. We believe the next real gain in coding agents will come from combining frontier intelligence with runtime orchestration. HydraFusion is our first bet on that idea: moving from choosing the best model to dynamically constructing the best way to solve each task.
Acknowledgments
A huge thank-you to the researchers, engineers, product managers, and designers across GitHub and Microsoft who curated the training data and built the training pipeline, evaluation suites, client experience, and serving stack. We are especially grateful to the GitHub Copilot CLI, Copilot API and VS Code team for overcoming numerous challenges to bring this research preview to our customers.
Meet the Team
 Aashna Garg, Principal Applied Scientist, Code AI
 Shengyu Fu, Partner Applied Science Manager, Code AI
 Carlos Castro, Partner Architect, GitHub Copilot
 Siddharth Singha Roy, Research Scientist II, Code AI
 Andy Salerno, Principal Software Engineer, GitHub Copilot
The post Project HydraFusion: Frontier quality via multi-model orchestration appeared first on The GitHub Blog.